
Short Trade Idea
Enter your short position between $225.66 (the intra-day high of its last bearish candlestick) and $231.96 (the lower band of its horizontal resistance zone).
Market Index Analysis
Boeing (NYSE:BA) is a member of the Dow Jones Industrial Average Index, the S&P 100 Index, and the S&P 500 Index.
All three indices remain near record highs with bearish trading volumes.
The Bull Bear Power Indicator for the S&P 500 Index is bullish with a negative divergence.
Market Sentiment Analysis
Equity futures are bearish this morning as oil prices are climbing amid stalled peace talks between the US and Iran. Still, markets have moved on from the war, assuming the worst is behind the economy, which could be a gross miscalculation regarding the persistent inflationary impact of high oil prices. Tesla, ServiceNow, and IBM fell after beating earnings, while American Express, Blackstone, and American Airlines are among today’s earnings.
Boeing Fundamental Analysis
Boeing is an aerospace and defense company that designs, manufactures, and sells airplanes, rotorcraft, rockets, satellites, and missiles. It is also the most significant US exporter by dollar value.
So, why am I bearish on BA following its earnings release?
Boeing reported revenues of $22.22 billion with an earnings per share loss of $0.20, beating expectations of $21.85 billion in revenues and an earnings per share loss of $0.69. Still, I remain bearish on Boeing amid margin pressures from rising aluminum prices, potential delays in 737 MAX 10 certification, and the failure to secure Chinese aircraft orders. While its defense segment should boom, BA suffers from ongoing cost overruns in programs like the KC-46 or CH-47, while valuations remain excessive.
Metric | Value | Verdict |
P/E Ratio | 91.78 | Bearish |
P/B Ratio | 31.61 | Bearish |
PEG Ratio | 6.53 | Bearish |
Current Ratio | 1.19 | Bearish |
ROIC-WACC Ratio | Negative | Bearish |
Boeing Fundamental Analysis Snapshot
The price-to-earnings (P/E) ratio of 91.78 makes BA an expensive stock. By comparison, the P/E ratio for the S&P 500 Index is 25.61.
The average analyst price target for BA is $265.76. This suggests good upside potential with rising downside risks.
Boeing Technical Analysis
Today’s BA Signal
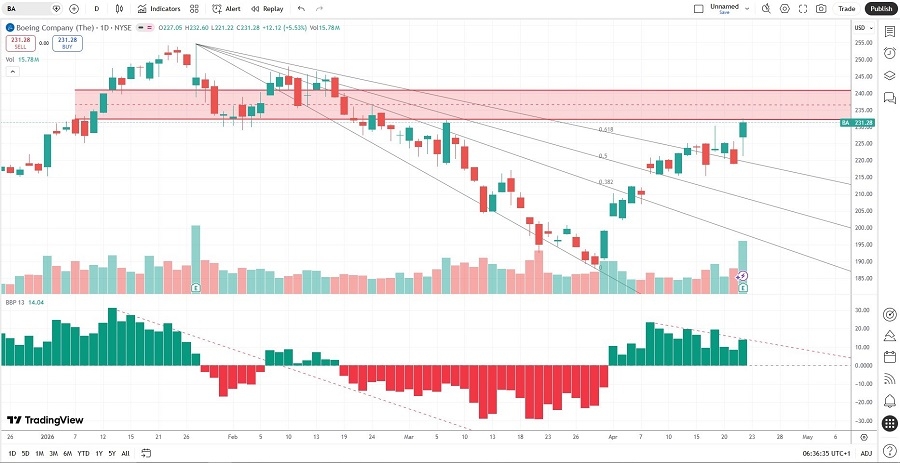
Boeing Price Chart
The BA D1 chart shows price action approaching a horizontal resistance zone.
It also shows price action breaking out above its descending Fibonacci Retracement Fan.
The Bull Bear Power Indicator is bullish with a negative divergence.
The average bullish trading volumes are higher than the average bearish trading volumes, suggesting more short-term volatility ahead.
BA rallied with the S&P 500 Index, a bullish confirmation, but bearish catalysts dominate.
My BA Short Stock Trade
BA Entry Level: Between $225.66 and $231.96
BA Take Profit: Between $176.77 and $187.72
BA Stop Loss: Between $247.40 and $254.35
Risk/Reward Ratio: 2.25
Ready to trade our analysis of Boeing? Here is our list of the best stockbrokers worth reviewing.