
Long Trade Idea
Enter your long position between $63.58 (yesterday’s intra-day low) and $65.63 (yesterday’s intra-day high).
Market Index Analysis
Best Buy (NYSE:BBY) is a member of the S&P 500 Index
This index is rebounding from 2026 lows, but with below-average bullish trading volumes
The Bull Bear Power Indicator for the S&P 500 Index is bearish with a descending trendline
Market Sentiment Analysis
Equity futures are higher following a powerful rally to close a dismal first quarter after Iran’s President Pezeshkian stated that his country is open to de-escalation under certain conditions, while US President Trump added that the US will end the Iran war in two to three weeks. Still, oil prices remain above $100, and the economic repercussions remain uncertain. Retail sales, ADP, and ISM manufacturing data could also move the market today.
Best Buy Fundamental Analysis
Best Buy is a consumer electronics retailer in an ongoing transition to a multichannel online-first retailer. It also produces in-house products, under eight brands.
So, why am I bullish on BBY following its breakout?
Best Buy is coming off an earnings beat despite a challenging consumer backdrop, and it has increased its dividend by 1.00% to $0.96 per share to a 6%+ dividend yield, signaling management’s confidence in future free cash flow generation. I am also bullish on its expansion in Marketplace and Best Buy Ads, as it improves profitability without inventory risk. The smaller store formats are another bullish development that should improve customer engagement, as they target urban and high-traffic areas.
Metric | Value | Verdict |
P/E Ratio | 12.74 | Bullish |
P/B Ratio | 5.93 | Bearish |
PEG Ratio | 1.05 | Bullish |
Current Ratio | 1.11 | Bearish |
ROIC-WACC Ratio | Positive | Bullish |
Best Buy Fundamental Analysis Snapshot
The price-to-earnings (P/E) ratio of 12.74 makes BBY an inexpensive stock. By comparison, the P/E ratio for the S&P 500 Index is 25.39.
The average analyst price target for BBY is $74.68. It suggests good upside potential with acceptable downside risks, and I see prices moving above this level.
Best Buy Technical Analysis
Today’s BBY Signal
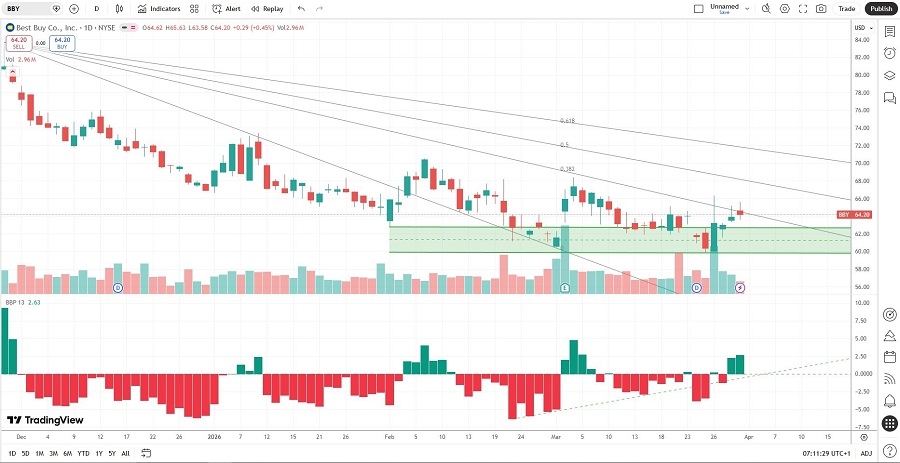
Best Buy Price Chart
The BBY D1 chart shows price action breaking out above a horizontal support zone.
It also shows price action between its descending 38.2% and 50.0% Fibonacci Retracement Fan levels, nearing a breakout.
The Bull Bear Power Indicator is bullish with an ascending trendline.
The average bullish trading volumes are higher than the average bearish trading volumes.
BBY outperformed the S&P 500 Index in March, a bullish confirmation.
My BBY Long Stock Trade
BBY Entry Level: Between $63.58 and $65.63
BBY Take Profit: Between $81.16 and $83.67
BBY Stop Loss: Between $55.00 and $56.17
Risk/Reward Ratio: 2.05
Ready to trade our analysis of BestBuy? Here is our list of the best stock brokers worth checking out.