
Gold can offer protection against inflation, stability during uncertain times, and a psychological wealth effect. The inverse relationship to the US Dollar adds to its appeal as a diversification asset.
What are Gold Stocks?
Gold stocks are publicly listed companies active in the gold sector. They are primarily involved in the exploration, extraction, and refining of gold. The recent adoption of AI has opened the path for service companies that use AI to discover deposits. Gold storage companies offer an alternative to direct gold exposure.
Why Should You Consider Investing in Gold Stocks?
Gold has always fascinated as a wealth and status symbol, but gold stocks offer numerous benefits, and investors should consider adding them to their portfolios. Gold outperforms during economic uncertainty and geopolitical events, providing downside protection for equity portfolios. Gold stocks can also offer an inflation hedge.
Here are a few things to consider when evaluating gold stocks:
Invest in a combination of established gold miners for stability and dividends, and junior miners, which carry greater risks but offer notable upside potential.
Analyze gold reserves of gold miners to gauge the longevity of their operations.
Focus 75% of your portfolio on gold stocks with mining operations in the top ten countries for gold production, with the remaining 25% on exciting global projects.
What are the Downsides of Gold Stocks?
Volatile gold prices pose the most notable risk, as they directly impact the profitability of gold stocks. While the last three years have witnessed high gold prices and all-time highs, which encouraged exploration and higher dividend yields, other periods have seen depressed prices.
Here is a shortlist of currently attractive gold stocks:
Coeur Mining (CDE)
Pan American Silver (PAAS)
Wheaton Precious Metals (WPM)
NovaGold Resources (NG)
Collective Mining (CNL)
An Update on our previous best gold stocks to buy now
In my previous installment, I highlighted the upside potential of Barrick Mining and McEwen.
Barrick Mining (NYSE:B) - A long position in B between $36.49 and $38.97
B advanced by over 16%, and my stop loss triggered at $43.00, resulting in a profit above 13%.
McEwen (NYSE:MUX) - A long position in MUX between $18.43 and $19.82
MUX surged by over 38%, and my stop loss triggered, closing this position at $25.00 for a profit exceeding 31%.
Coeur Mining (NYSE:CDE) Fundamental Analysis
Coeur Mining (NYSE:CDE) is a gold and silver producer in the United States, Canada, and Mexico, while also exploring for zinc, lead, and other related metals. It is also a constituent of the Russell 2000 Index.
So, why am I bullish on Coeur Mining despite its recent correction?
The $7 billion acquisition of New Gold, completed four weeks ago, is driving my bullish narrative together with low valuations. CDE also raised its 2026 output forecasts to 680,000 to 815,000 ounces of gold, 18.7 to 21.9 million ounces of silver, and 50 to 65 million pounds of copper, with the latter adding excellent copper exposure and revenue diversification. Therefore, I expect its next earnings release, in May, to deliver a bullish catalyst.
Metric | Value | Verdict |
P/E Ratio | 19.87 | Bullish |
P/B Ratio | 5.90 | Bearish |
PEG Ratio | Unavailable | Bearish |
Current Ratio | 2.47 | Bullish |
Return on Assets | 13.22% | Bullish |
Return on Equity | 26.41% | Bullish |
Profit Margin | 28.30% | Bullish |
ROIC-WACC Ratio | Positive | Bullish |
Dividend Yield | 0.00% | Bearish |
Coeur Mining Fundamental Analysis Snapshot
The price-to-earnings (P/E) ratio of 23.10 makes Coeur Mining an inexpensive stock. By comparison, the P/E ratio for the S&P 500 Index is 25.79.
The average analyst price target for Coeur Mining is $27.55. This suggests excellent upside potential with decreasing downside risks.
Coeur Mining Technical Analysis
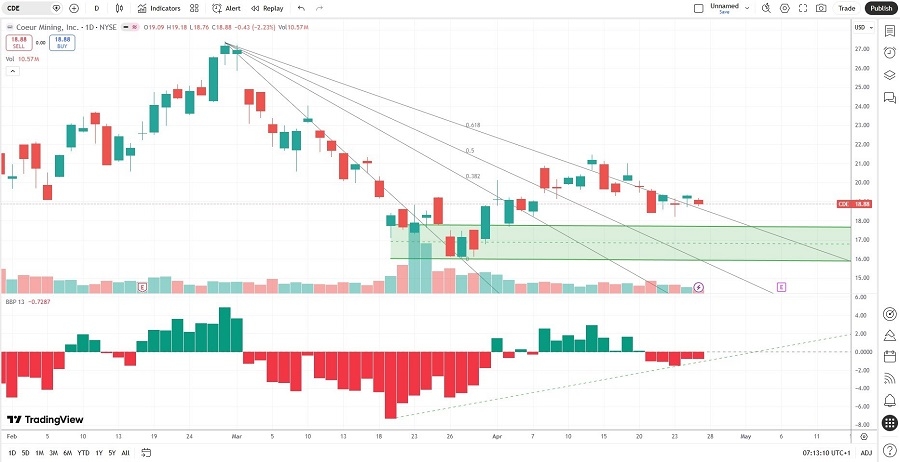
Coeur Mining Price Chart
The Coeur Mining D1 chart shows price action breaking out above the descending Fibonacci Retracement Fan.
It also shows Coeur Mining approaching a retest of its horizontal support zone following its breakout.
The Bull Bear Power Indicator is bearish with an ascending trendline, approaching a bullish crossover.
My Coeur Mining Long Stock Trade
CDE Entry Level: Between $18.20 and $19.18
CDE Take Profit: Between $25.86 and $27.38
CDE Stop Loss: Between $14.66 and $15.38
Risk/Reward Ratio: 2.16
Pan American Silver (NYSE:PAAS) Fundamental Analysis
Pan American Silver (NYSE:PAAS) mines and explores silver, ranking among the largest silver producers globally, as well as gold, zinc, lead, and copper, with operations in Mexico, Peru, Bolivia, and Argentina.
So, why am I bullish on Pan American Silver at current levels?
I am bullish on Pan American Silver due to its low-cost production and increased 2026 production growth forecast, which includes 25.0 to 27.0 million ounces of silver and 700 to 750 thousand ounces of gold, potentially yielding record free cash flow. I am equally bullish about its revised Preliminary Economic Assessment (PEA) for the La Colorada Skarn project. It resulted in a lower-risk, internally funded project with excellent upside potential.
Metric | Value | Verdict |
P/E Ratio | 21.57 | Bullish |
P/B Ratio | 3.33 | Bearish |
PEG Ratio | Unavailable | Bearish |
Current Ratio | 2.69 | Bullish |
Return on Assets | 8.48% | Bullish |
Return on Equity | 16.73% | Bullish |
Profit Margin | 27.02% | Bullish |
ROIC-WACC Ratio | Positive | Bullish |
Dividend Yield | 0.96% | Bearish |
Pan American Silver Fundamental Analysis Snapshot
The price-to-earnings (P/E) ratio of 21.57 makes Pan American Silver an inexpensive stock. By comparison, the P/E ratio for the S&P 500 Index is 25.79.
The average analyst price target for Pan American Silver is $73.25. Thus suggests excellent upside potential with manageable downside risks.
Pan American Silver Technical Analysis
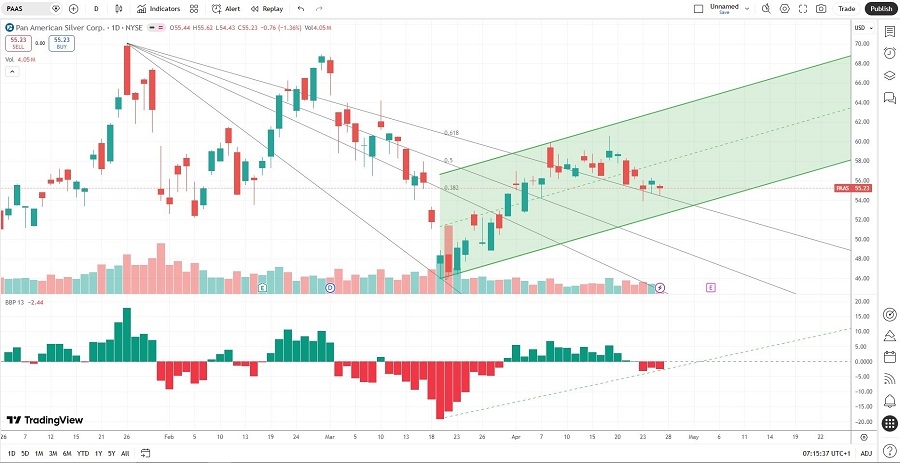
Pan American Silver Price Chart
The Pan American Silver D1 chart shows price action breaking out above the descending Fibonacci Retracement Fan.
It also shows Pan American Silver inside a bullish price channel.
The Bull Bear Power Indicator is bearish with an ascending trendline, approaching a bullish crossover.
My Pan American Silver Long Stock Trade
PAAS Entry Level: Between $53.85 and $56.26
PAAS Take Profit: Between $70.93 and $73.12
PAAS Stop Loss: Between $45.94 and $48.88
Risk/Reward Ratio: 2.16
Ready to trade our analysis of the best gold stocks? Here is our list of the best stockbrokers worth reviewing.