
Nuclear energy experienced a significant stagnation following the nuclear reactor disaster of 2011 in Japan. Still, the push towards clean energy and the surge in power demand from data centers that fuel the AI hype have made nuclear energy attractive again.
What Are Nuclear Energy Stocks?
Nuclear energy stocks are publicly listed companies active in the nuclear energy sector. They primarily operate nuclear reactors to generate electricity. Alternatively, investors can participate in nuclear energy through uranium mining stocks.
Why Should You Consider Investing in Nuclear Energy Stocks?
Nuclear energy is a cornerstone of clean energy, and small modular reactors (SMRs) represent the industry’s most significant breakthrough. They can address the tremendous energy demand posed by data centers and AI. Forecasts estimate nuclear energy investment to exceed $2 trillion by 2050. With energy needs rising, energy security a national security concern for most countries, and the need to lower carbon emissions, nuclear energy has a bright future.
Here are a few things to consider when evaluating nuclear energy stocks:
Invest in nuclear energy stocks that have signed deals with some of the most notable end-users like tech giants Meta Platforms, Microsoft, Amazon, and Alphabet.
Analyze next-generation nuclear energy stocks that can power the future with disruptive technologies, including nuclear fusion reactors.
Mix your nuclear energy portfolio with established nuclear energy stocks, uranium miners, and next-generation players to diversify your exposure.
What are the Downsides of Nuclear Energy Stocks?
Uranium miners may struggle to meet demand, and uranium prices are volatile. Despite its clean energy appeal, opponents will try to derail or limit its potential due to concerns about nuclear waste and its environmental impact, which pose significant storage challenges. Nuclear energy experienced three major catastrophes: Chernobyl (1986), Three Mile Island (1979), and Fukushima (2011). Therefore, resistance to new nuclear reactors could delay deployment.
Here is a shortlist of currently attractive nuclear energy stocks:
BWX Technologies (BWXT)
PG&E Corporation (PCG)
Cameco (CCJ)
NuScale Power (SMR)
Oklo (OKLO)
An Update on My Previous Best Nuclear Energy Stocks Item
In the previous installment, I highlighted the upside potential of enCore Energy and Denison Mines.
enCore Energy (NASDAQ:EU) - A long position in EU between $1.66 and $1.71.
EU rallied nearly 25.00%, and my stop-loss was triggered at $2.10, for a 20% profit.
Denison Mines (NYSE Arca:DNN) - A long position in DNN between $3.24 and $3.49.
DNN surged over 25%, and I closed this position for a profit above 21% after my stop-loss triggered at $4.00.
BWX Technologies (NYSE:BWXT) Fundamental Analysis
BWX Technologies (BWXT) is a manufacturing company that supplies nuclear components and fuel. BWXT operates via BWXT mPower, BWXT Nuclear Energy, BWXT Nuclear Operations Group, and BWXT Technical Services Group. It is also a member of the S&P 400.
So, why am I bullish on BWX Technologies following its breakout?
BWX Technologies offered upbeat 2026 guidance amid a record backlog of $7.3 billion, up over 50% year-on-year, driven by naval propulsion and commercial nuclear power. It also secured a National Nuclear Security Administration (NNSA) agreement worth $1.5 billion to enhance domestic uranium enrichment. I am equally bullish on its partnership with the H3AT Tritium Loop Facility, placing it at the forefront of next-generation fusion technology.
Metric | Value | Verdict |
P/E Ratio | 62.03 | Bearish |
P/B Ratio | 16.59 | Bearish |
PEG Ratio | Unavailable | Bearish |
Current Ratio | 2.32 | Bullish |
Return on Assets | 5.95% | Bullish |
Return on Equity | 28.52% | Bullish |
Profit Margin | 10.28% | Bullish |
ROIC-WACC Ratio | Negative | Bearish |
Dividend Yield | 1.02% | Bearish |
BWX Technologies Fundamental Analysis Snapshot
The price-to-earning (P/E) ratio of 62.03 makes BWXT an expensive stock. By comparison, the P/E ratio for the S&P 500 is 25.79.
The average analyst price target for BWX Technologies is $234.55, but I see prices moving higher towards the high-end estimate of $290.00, suggesting excellent upside potential with reasonable downside risk.
BWX Technologies Technical Analysis
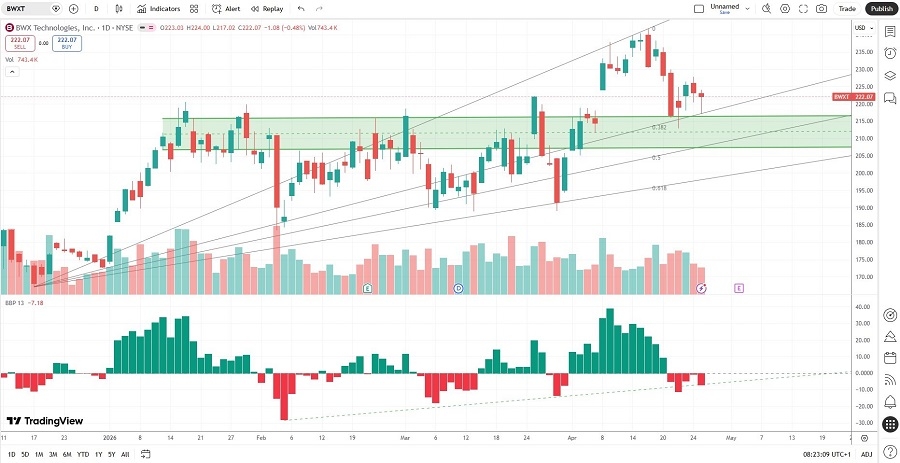
BWX Technologies Price Chart
The BWX Technologies D1 chart shows price action between its ascending 0.0% and 38.2% Fibonacci Retracement Fan levels.
It also shows BWX Technologies breaking out above a horizontal support zone.
The Bull Bear Power Indicator is bearish with an ascending trendline.
My BWX Technologies Long Stock Trade
BWXT Entry Level: Between $215.81 and $224.00
BWXT Take Profit: Between $272.12 and $280.29
BWXT Stop Loss: Between $189.00 and $197.22
Risk/Reward Ratio: 2.10
PG&E Corporation (NYSE:PCG) Fundamental Analysis
PG&E Corporation (NYSE:PCG) is an investor-owned utility providing natural gas and electricity to 5.2 million households. It owns and operates the Diablo Canyon Power Plant, California’s only nuclear power plant and largest power station. PCG is also a constituent of the S&P 500 Index.
So, why am I bullish on PG&E Corporation amid its recent correction?
I turned bullish on PG&E Corporation after it reported a 37% year-over-year surge in utility net income to $954 million with a 20% rise in operating income amid higher electricity cost recovery and extended Diablo Canyon operations. The $6.3 billion Wildfire Fund to cover wildfire risk mitigation has reduced financial risk, while PG&E has a sound $12.4 billion capital spending plan to modernize its grid and improve reliability.
Metric | Value | Verdict |
P/E Ratio | 12.71 | Bullish |
P/B Ratio | 1.14 | Bullish |
PEG Ratio | 0.71 | Bullish |
Current Ratio | 1.20 | Bearish |
Return on Assets | 2.53% | Bullish |
Return on Equity | 8.83% | Bullish |
Profit Margin | 11.01% | Bullish |
ROIC-WACC Ratio | Positive | Bullish |
Dividend Yield | 1.22% | Bearish |
PG&E Corporation Fundamental Analysis Snapshot
The price-to-earnings (P/E) ratio of 12.71 makes PG&E Corporation an inexpensive stock. By comparison, the P/E ratio for the S&P 500 Index is 25.79.
The average analyst price target for PG&E Corporation is $22.84. It suggests excellent upside potential with manageable downside risk.
PG&E Corporation Technical Analysis
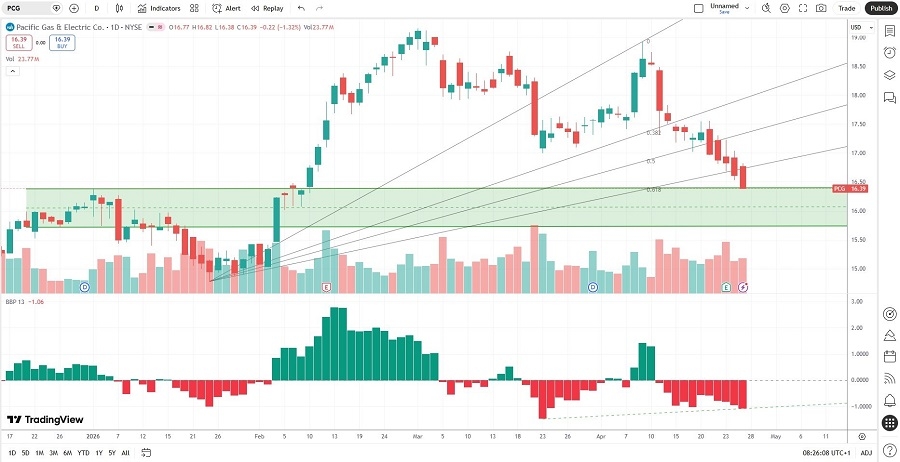
PG&E Corporation Price Chart
The PG&E Corporation D1 chart shows price action below its ascending Fibonacci Retracement Fan.
It also shows PG&E Corporation entering a massive horizontal support zone.
The Bull Bear Power Indicator is bearish with a positive divergence.
My PG&E Corporation Long Stock Trade
PCG Entry Level: Between $16.01 and $16.68
PCG Take Profit: Between $21.72 and $22.84
PCG Stop Loss: Between $13.34 and $14.01
Risk/Reward Ratio: 2.14
Ready to trade our analysis of the best nuclear energy stocks? Here is our list of the best stockbrokers worth reviewing.