
Short Trade Idea
Enter your short position between $53.71 (yesterday’s intra-day low) and $55.40 (the lower band of its horizontal resistance zone).
Market Index Analysis
Bank of America (NYSE:BAC) is a member of the S&P 100 Index and the S&P 500 Index.
Both indices are pushing towards fresh all-time highs on low trading volumes, lacking confirmation.
The Bull Bear Power Indicator for the S&P 500 Index is extremely bullish, confirming a disconnect to economic reality.
Market Sentiment Analysis
Equity futures are inching higher this morning after the S&P 500 index and the NASDAQ 100 index recorded fresh all-time highs. Markets once again price geopolitics and earnings outlooks for the current quarter to perfection, including receding inflation and interest rate cuts. Netflix, PepsiCo, and Charles Schwab will report earnings today, while initial jobless claims and industrial production data are also due.
Bank of America Fundamental Analysis
Bank of America is a financial services holding company that handles roughly 10% of all US deposits. It is one of the Big Four US banking institutions and one of eight systemically important financial institutions.
So, why am I bearish on BAC following its earnings release?
First-quarter revenues came in at $30.27 billion, beating expectations of $29.95 billion, and earnings per share of $1.11, beating expectations of $1.01. While its trading desk thrived amid market volatility, I remain bearish due to concentration risks in the US consumer, which is under ongoing strain and surging debt. The regulatory proposal to cap credit card interest at 10% adds to medium-term uncertainty, while institutional sentiment remains depressed after Buffett’s exit.
Metric | Value | Verdict |
P/E Ratio | 13.51 | Bullish |
P/B Ratio | 1.40 | Bullish |
PEG Ratio | 1.00 | Bullish |
Current Ratio | Unavailable | Bearish |
ROIC-WACC Ratio | Negative | Bearish |
Bank of America Fundamental Analysis Snapshot
The price-to-earnings (P/E) ratio of 13.51 makes BAC an inexpensive stock. By comparison, the P/E ratio for the S&P 500 Index is 30.16.
The average analyst price target for BAC is $61.52. This suggests moderate upside potential with elevated downside risks.
Bank of America Technical Analysis
Today’s BAC Signal
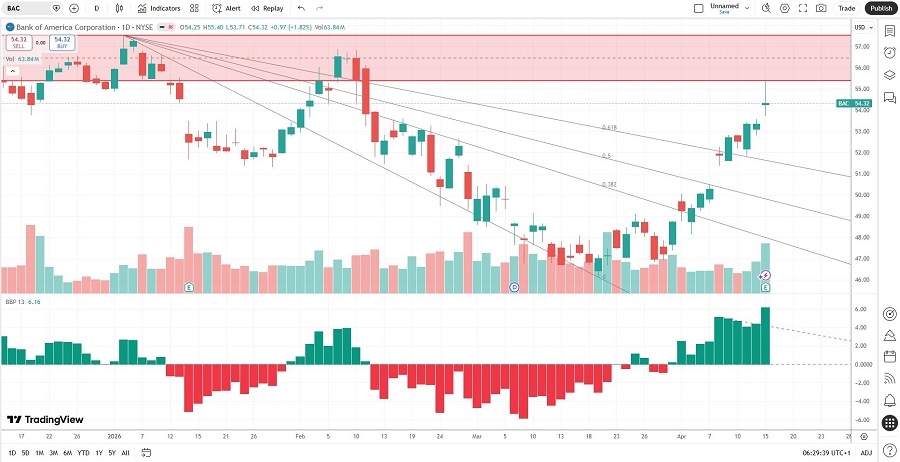
Bank of America Price Chart
The BAC D1 chart shows price action being rejected by its horizontal resistance zone.
It also shows price action breaking out above its ascending Fibonacci Retracement Fan.
The Bull Bear Power Indicator is bullish and pushed above its descending trendline.
The average bullish trading volumes are higher than the average bearish trading volumes, suggesting more short-term volatility.
BAC advanced with the S&P 500 Index, a bullish confirmation, but bearish catalysts are accumulating.
My BAC Short Stock Trade
BAC Entry Level: Between $53.71 and $55.40
BAC Take Profit: Between $39.18 and $40.56
BAC Stop Loss: Between $59.35 and $60.56
Risk/Reward Ratio: 2.58
Ready to trade our analysis of Bank of America? Here is our list of the best stock brokers worth reviewing.