
Long Trade Idea
Enter your long position between $3,479.56 (an intermediate horizontal support level) and $3,544.73 (the intra-day high of its last bearish candlestick).
Market Index Analysis
AutoZone (NYSE:AZO) is a member of the S&P 500 Index.
This index rallied on low bullish trading volumes, making it vulnerable to a reversal.
The Bull Bear Power Indicator for the S&P 500 Index is bullish but risks the development of a negative divergence.
Market Sentiment Analysis
Equity futures are steady this morning amid cautious optimism that the US and Iran will reach a peace deal, after US President Trump claimed that Iran has reached out following the apparent US blockade of Iranian ports. Oil dropped below $100 per barrel but remains uncomfortably high. Global consumer confidence continues to plunge, Chinese exports missed expectations, and markets will refocus on earnings season, where the AI trade will remain dominant.
AutoZone Fundamental Analysis
AutoZone is the largest US retailer of automotive parts. It thrives in the DIY sector and the automotive aftermarket. It operates over 7,700 locations across the US, Mexico, Brazil, Puerto Rico, and the US Virgin Islands.
So, why am I bullish on AZO at current levels?
I remain bullish on AutoZone’s international expansion and increased market share. Its second-quarter sales growth came in at 8.1% year-over-year, and it opened 64 new stores, continuing its aggressive expansion, with a total of 350+ new stores opening in fiscal 2026, which will drive market penetration. I am equally bullish on its mega-hub strategy, as it improves parts availability and service speed, especially in the high-growth DIFM segment, where AZO is expanding notably.
Metric | Value | Verdict |
P/E Ratio | 24.63 | Bullish |
P/B Ratio | -17.43 | Bearish |
PEG Ratio | 1.92 | Bullish |
Current Ratio | 0.89 | Bearish |
ROIC-WACC Ratio | Positive | Bullish |
AutoZone Fundamental Analysis Snapshot
The price-to-earning (P/E) ratio of 24.63 makes AZO an inexpensive stock. By comparison, the P/E ratio for the S&P 500 Index is 26.17.
The average analyst price target for AZO is $4,204.74. This suggests excellent upside potential with acceptable downside risks.
AutoZone Technical Analysis
Today’s AZO Signal
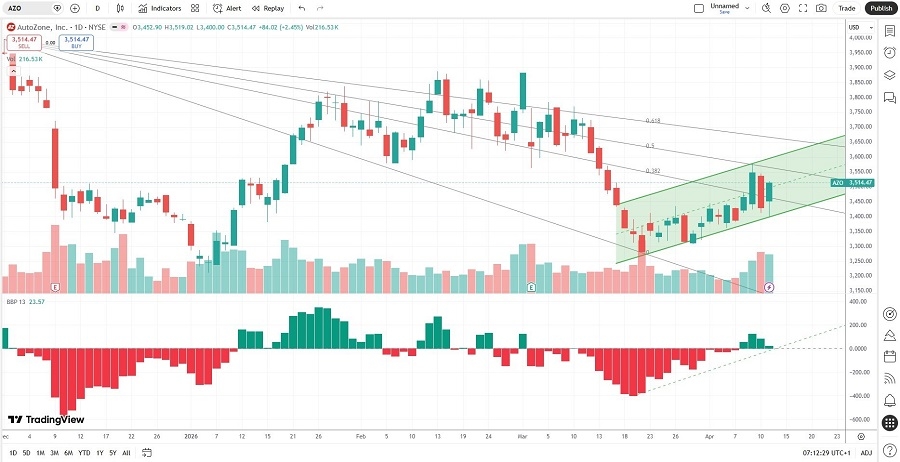
AutoZone Price Chart
The AZO D1 chart shows price action inside a bullish price channel.
It also shows price action between its descending 38.2% and 50.0% Fibonacci Retracement Fan levels.
The Bull Bear Power Indicator is bullish with an ascending trendline.
The average bullish trading volumes are higher than the average bearish trading volumes.
AZO recovered with the S&P 500 Index, a bullish confirmation.
My AZO Long Stock Trade
AZO Entry Level: Between $3,479.56 and $3,544.73
AZO Take Profit: Between $3,939.00 and $3,996.25
AZO Stop Loss: Between $3,281.23 and $3,306.54
Risk/Reward Ratio: 2.32
Ready to trade our analysis of AutoZone? Here is our list of the best stock brokers worth checking out.