
Long Trade Idea
Enter your long position between $24.96 (the upper band of its horizontal support zone) and $26.04 (the intra-day low of its last bearish candlestick).
Market Index Analysis
AT&T (NYSE:T) is a member of the S&P 100 Index and the S&P 500 Index.
Both indices remain near record highs with bearish trading volumes.
The Bull Bear Power Indicator for the S&P 500 Index is bullish with a negative divergence.
Market Sentiment Analysis
Equity futures are bearish this morning as oil prices are climbing amid stalled peace talks between the US and Iran. Still, markets have moved on from the war, assuming the worst is behind the economy, which could be a gross miscalculation regarding the persistent inflationary impact of high oil prices. Tesla, ServiceNow, and IBM fell after beating earnings, while American Express, Blackstone, and American Airlines are among today’s earnings.
AT&T Fundamental Analysis
AT&T is a telecommunications holding company. It is also the third-largest telecom company by revenue globally and the third-largest mobile company in the US.
So, why am I bullish on T following its earnings sell-off?
AT&T beat revenue and earnings-per-share expectations of $31.25 billion and $0.55, reporting revenues of $31.51 billion and $0.57, respectively. I remain bullish amid its promising fiber and wireless business, which added 512,000 advanced home internet customers last quarter. Strong free cash flow of $2.5 billion, a new $10 billion share buyback program, and strategic initiatives such as AT&T OneConnect, the integration of Lumen’s fiber assets, and AI and digitalization add to the bullish catalysts.
Metric | Value | Verdict |
P/E Ratio | 8.55 | Bullish |
P/B Ratio | 1.64 | Bullish |
PEG Ratio | 1.46 | Bullish |
Current Ratio | 0.91 | Bearish |
ROIC-WACC Ratio | Positive | Bullish |
AT&T Fundamental Analysis Snapshot
The price-to-earnings (P/E) ratio of 8.55 makes T an inexpensive stock. By comparison, the P/E ratio for the S&P 500 Index is 25.61.
The average analyst price target for T is $30.43. This suggests excellent upside potential with fading downside risk.
AT&T Technical Analysis
Today’s T Signal
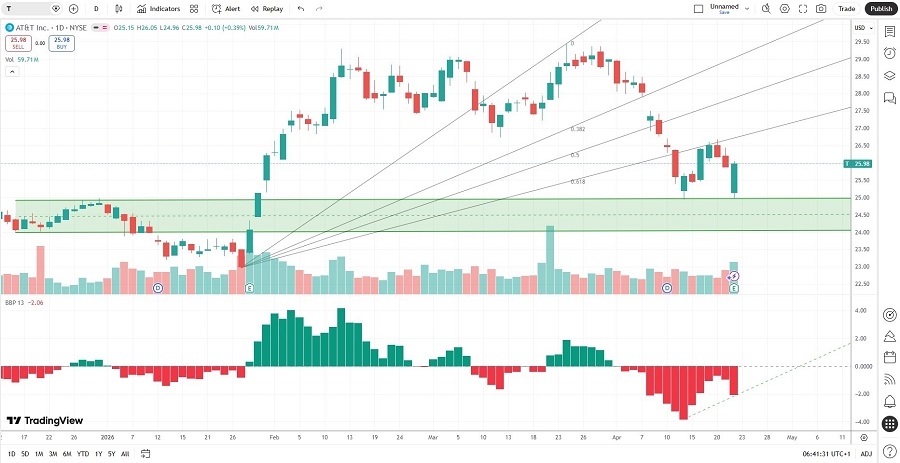
AT&T Price Chart
The T D1 chart shows price action approaching a horizontal support zone.
It also shows price action breaking down below its ascending Fibonacci Retracement Fan.
The Bull Bear Power Indicator is bearish with an ascending trendline.
The average bullish trading volumes are higher than the average bearish trading volumes.
T retreated as the S&P 500 Index advanced, a bearish confirmation, but bullish indicators are accumulating.
My T Long Stock Trade
T Entry Level: Between $24.96 and $26.04
T Take Profit: Between $29.44 and $30.43
T Stop Loss: Between $22.95 and $23.87
Risk/Reward Ratio: 2.23
Ready to trade our analysis of the ATT? Here is our list of the best stockbrokers worth reviewing.