
Long Trade Idea
Enter your long position between €157.42 (the lower band of its horizontal support zone) and €162.08 (yesterday’s intra-day high).
Market Index Analysis
Airbus (Euronext Paris:AIR.PA) is a member of the CAC 40 Index, the DAX Index, and the Euro STOXX 50 Index
All three indices are recovering from 2026 lows, nearing a breakout
The Bull Bear Power Indicator for the CAC 40 Index is bearish with a positive divergence
Market Sentiment Analysis
Equity futures are higher following a powerful rally to close a dismal first quarter after Iran’s President Pezeshkian stated that his country is open to de-escalation under certain conditions, while US President Trump added that the US will end the Iran war in two to three weeks. Still, oil prices remain above $100, and the economic repercussions remain uncertain. Retail sales, ADP, and ISM manufacturing data could also move the market today.
Airbus Fundamental Analysis
Airbus is an aerospace and defense corporation. It is the world’s leading helicopter and airline manufacturer. It operates offices and assembly plants in France, Germany, Spain, the UK, Canada, Malaysia, the US, Morocco, and India.
So, why am I bullish on AIR.PA at current levels?
I am bullish on Airbus due to its active backlog of over 8,700 aircraft, offering long-term revenue visibility. It benefits from improved supply chain execution, as evidenced by its 2025 delivery performance. I am equally bullish on its Defense and Space, and Helicopter units. It has no competition on long-range, single-aisle routes with its A321XLR and A320neo planes, giving it pricing power. India’s UDAN Scheme and Airbus’ global production expansion add long-term bullish catalysts.
Metric | Value | Verdict |
P/E Ratio | 24.33 | Bearish |
P/B Ratio | 6.95 | Bearish |
PEG Ratio | 1.18 | Bullish |
Current Ratio | 1.16 | Bearish |
ROIC-WACC Ratio | Negative | Bearish |
Airbus Fundamental Analysis Snapshot
The price-to-earnings (P/E) ratio of 24.33 makes AIR.PA an expensive stock. By comparison, the P/E ratio for the CAC 40 Index is 19.21.
The average analyst price target for AIR.PA is €217.64. It suggests excellent upside potential with decreasing downside risks.
Airbus Technical Analysis
Today’s AIR.PA Signal
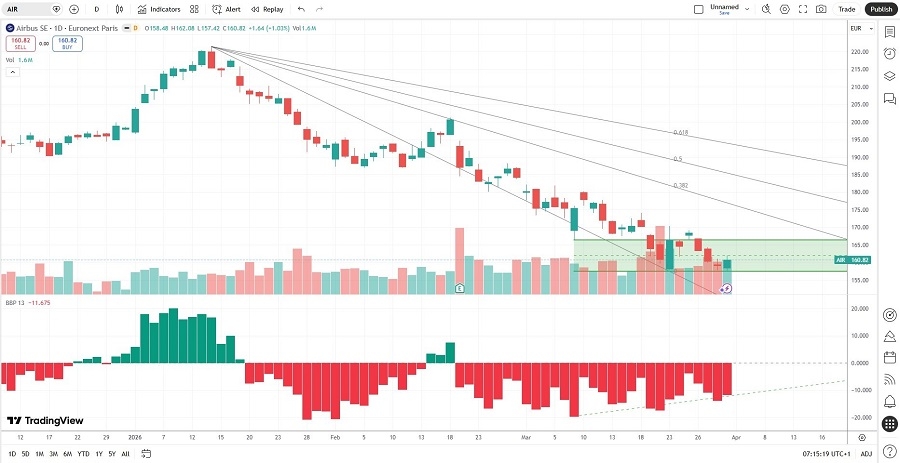
Airbus Price Chart
The AIR.PA D1 chart shows price action inside a horizontal support zone.
It also shows price action between its descending 0.0% and 38.2% Fibonacci Retracement Fan levels.
The Bull Bear Power Indicator is bearish with a positive divergence.
The average bearish trading volumes are higher than the average bullish trading volumes, suggesting more short-term volatility.
AIR.PA corrected with the CAC 40 Index, a bearish confirmation, but bullish factors are rising.
My AIR.PA Long Stock Trade
AIR.PA Entry Level: Between €157.42 and €162.08
AIR.PA Take Profit: Between €211.11 and €217.64
AIR.PA Stop Loss: Between €131.90 and €138.02
Risk/Reward Ratio: 2.10
Ready to trade our analysis of BestBuy? Here is our list of the best stock brokers worth checking out.