
Short Trade Idea
Enter your short position between $50.75 (yesterday’s intra-day low) and $51.67 (the upper band of its horizontal resistance zone).
Market Index Analysis
Verizon Communications (NYSE:VZ) is a member of the Dow Jones Industrial Average Index, the S&P 100 Index, and the S&P 500 Index.
All three indices trade inside bearish price channels as downside catalysts accumulate.
The Bull Bear Power Indicator for the S&P 500 Index is bearish with a descending trendline.
Market Sentiment Analysis
Equity futures are suggesting a bearish open as markets remain uncertain about President Trump’s Iran war strategy, as he calls for assistance, while also stating that he will focus on Cuba next. Volatility should remain elevated, and oil prices are moving higher, with Brent above $100. The Fed is expected to keep interest rates on hold this week, but the Reserve Bank of Australia hiked interest rates amid inflationary pressures. Earnings from Tencent, DocuSign, and Oklo are also on deck today.
Verizon Communications Fundamental Analysis
Verizon Communications is the largest mobile carrier in the US and the second-largest global telecommunications company based on revenue. It employs nearly 100,000 people and serves over 146 million customers.
So, why am I bearish on VZ following its 33%+ rally?
While Verizon Communications is changing its revenue reporting structure, and valuations are low, I turned bearish due to its stagnant growth projections and customer churn. Network reliability concerns following the significant January 2026 outage, which affected millions of customers, add to my medium-term concerns. VZ’s pricing strategy led to the loss of approximately 2.25 million customers over the past few years, further adding to reputational risks.
Metric | Value | Verdict |
P/E Ratio | 12.55 | Bullish |
P/B Ratio | 2.06 | Bearish |
PEG Ratio | 1.26 | Bullish |
Current Ratio | 0.91 | Bearish |
ROIC-WACC Ratio | Positive | Bullish |
Verizon Communications Fundamental Analysis Snapshot
The price-to-earnings (P/E) ratio of 12.55 makes VZ an inexpensive stock. By comparison, the P/E ratio for the S&P 500 Index is 26.59.
The average analyst price target for VZ is $50.54. This suggests no upside potential, but downside risks remain greater.
Verizon Communications Technical Analysis
Today’s VZ Signal
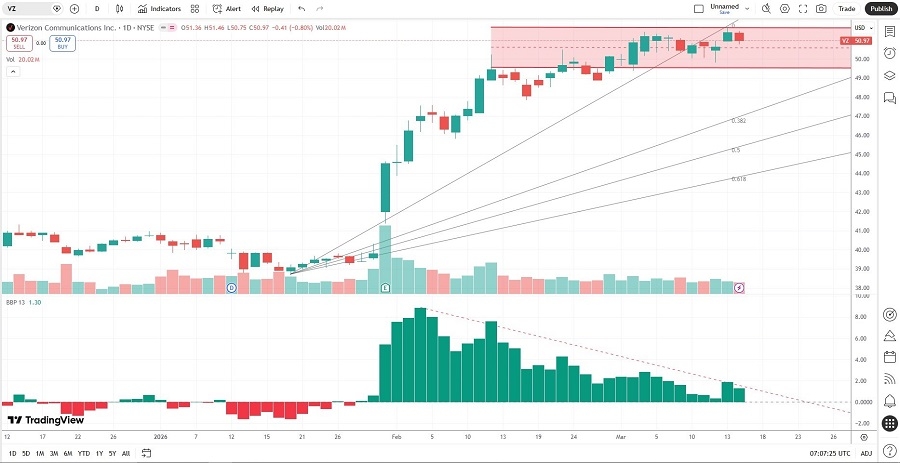
Verizon Communications Price Chart
The VZ D1 chart shows price action inside a horizontal resistance zone.
It also shows price action between its ascending 0.0% and 38.2% Fibonacci Retracement Fan levels.
The Bull Bear Power Indicator is bullish with a negative divergence.
The average bearish trading volumes are higher than the average bullish trading volumes.
VZ advanced as the S&P 500 Index moved lower, a bullish trading signal, but breakdown catalysts are rising.
My VZ Short Stock Trade
VZ Entry Level: Between $50.75 and $51.67
VZ Take Profit: Between $41.38 and $42.06
VZ Stop Loss: Between $54.33 and $55.44
Risk/Reward Ratio: 2.62
Ready to trade our analysis of Verizon? Here is our list of the best stock brokers worth reviewing.