
Long Trade Idea
Enter your long position between $278.66 (yesterday’s intra-day low) and $285.21 (yesterday’s intra-day high).
Market Index Analysis
UnitedHealth Group (UNH) is a member of the Dow Jones Industrial Average, the S&P 100 Index, and the S&P 500 Index.
All three indices move lower inside bearish chart patterns with rising bearish trading volumes.
The Bull Bear Power Indicator of the S&P 500 Index is bearish with a descending trendline.
Market Sentiment Analysis
Equity futures are lower this morning following yesterday’s volatile session that saw markets plunge at the open as oil prices soared to nearly $120 per barrel before mounting a massive reversal amid comments by President Trump that the Itan war is nearing its end, which sent oil prices tumbling below $90 per barrel. Stagflation concerns are rising, and markets will parse through tomorrow’s CPI and Friday’s PCI reports. China’s exports surged despite Trump’s tariffs, while Oracle’s earnings today and Adobe’s on Thursday will be the next catalysts for the AI trade.
UnitedHealth Group Fundamental Analysis
UnitedHealth Group is a leading US health insurer and healthcare provider. UNH is the largest healthcare company by revenue and the world’s seventh-largest company by revenue.
So, why am I bullish on UNH after its breakout?
I am bullish about its ongoing margin recovery, driven by strategic repricing and almost $1 billion in cost reductions. The implementation of AI to combat pharmacy fraud is another bullish catalyst that could result in rising net profits. I am equally bullish on its Optum division, where AI accounts for over 80% of member engagement. The 5-year PEG ratio confirms an undervalued company with excellent growth prospects.
Metric | Value | Verdict |
P/E Ratio | 21.55 | Bullish |
P/B Ratio | 2.76 | Bearish |
PEG Ratio | 1.09 | Bullish |
Current Ratio | 0.79 | Bearish |
ROIC-WACC Ratio | Positive | Bullish |
UnitedHealth Group Fundamental Analysis Snapshot
The price-to-earnings (P/E) ratio of 21.55 indicates UNH is an inexpensive stock. By comparison, the P/E ratio for the S&P 500 Index is 26.29.
The average analyst price target for UNH is $362.54, suggesting excellent upside potential with manageable downside risk.
UnitedHealth Group Technical Analysis
Today’s UNH Signal
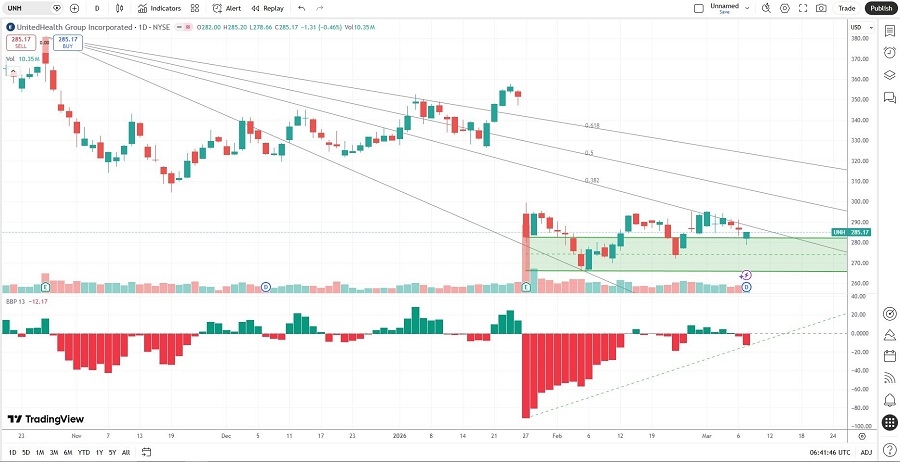
UnitedHealth Group Price Chart
The UNH D1 chart shows price action breaking out above its horizontal support zone.
It also shows price action between its descending 0.0% and 38.2% Fibonacci Retracement Fan levels.
The Bull Bear Power Indicator turned bearish but remains above its descending trendline.
The average bullish trading volumes are higher than the average bearish trading volumes.
UNH drifted higher while the S&P 500 corrected, a significant bullish trading signal.
My UNH Long Stock Trade
UNH Entry Level: Between $278.66 and $285.21
UNH Take Profit: Between $369.57 and $381.00
UNH Stop Loss: Between $234.60 and $244.37
Risk/Reward Ratio: 2.06
Ready to trade our analysis of UnitedHealth Group? Here is our list of the best stock brokers worth reviewing.