
Long Trade Idea
Enter your long position between €75.91 (yesterday’s intra-day low) and €77.41 (yesterday’s intra-day high).
Market Index Analysis
TotalEnergies (EPA:TTE) is a member of the CAC 40 Index and the Euro STOXX 50 Index.
Both indices attempt to stabilize at horizontal support zones.
The Bull Bear Power Indicator for the CAC 40 Index is bearish with a positive divergence.
Market Sentiment Analysis
Equity futures suggest a bullish open amid optimism over de-escalation in the Iran war, following the US submitting a 15-point proposal via Pakistan to Iran to end the war. Volatility is likely to remain until more details emerge, especially in oil, which remains off its war peak, but at elevated levels, with Brent trading above and below $100 per barrel. On the economic front, today’s US import export data is on deck. In AI-related news, ARM’s new in-house chips increase competition across the semiconductor space.
TotalEnergies Fundamental Analysis
TotalEnergies is an integrated energy and petroleum company, ranking among the seven supermajor oil companies. It engages in crude oil and natural gas exploration, power generation, transportation, refining, petroleum product marketing, and international crude oil and product trading. TotalEnergies is also a large-scale chemicals manufacturer.
So, why am I bullish on TTE.PA despite its 49%+ rally?
I remain bullish on TotalEnergies due to its expanding cash flow that supports a dividend yield of roughly 5%. I am equally bullish about new projects in Brazil, Iraq, Algeria, and Uganda, which could boost 2026 production growth by over 5%. The strategic cost savings are another tailwind. While the Trump administration will reimburse TotalEnergies $1 billion for abandoning its US wind project and reinvest in oil and gas, its energy transition strategy remains intact to expand renewable capacity to 34–42 GW this year.
Metric | Value | Verdict |
P/E Ratio | 15.44 | Bullish |
P/B Ratio | 1.66 | Bullish |
PEG Ratio | 2.16 | Bullish |
Current Ratio | 0.97 | Bearish |
ROIC-WACC Ratio | Positive | Bullish |
TotalEnergies Fundamental Analysis Snapshot
The price-to-earning (P/E) ratio of 15.44 indicates that TTE is a relatively inexpensive stock. By comparison, the P/E ratio for the CAC 40 Index is 19.58.
The average analyst price target for TTE.PA is €73.81. It suggests no upside potential, but I see prices moving towards the high-end forecast of €93.10, while downside risks are manageable.
TotalEnergies Technical Analysis
Today’s TTE Signal
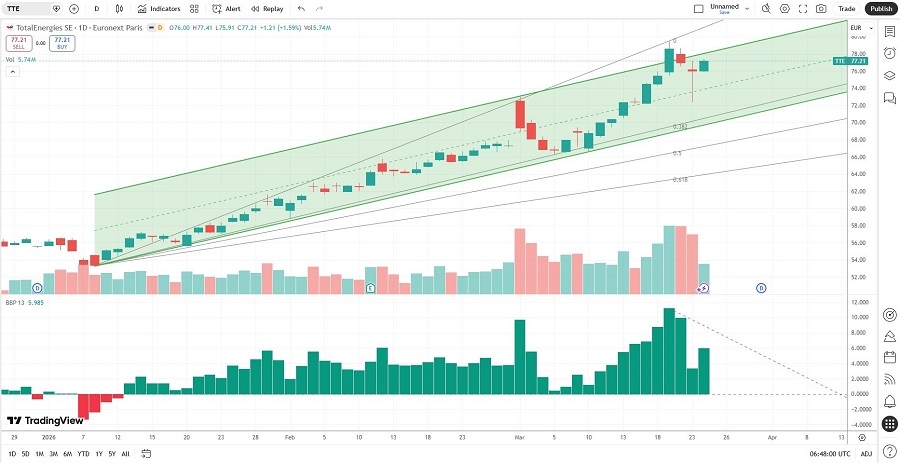
TotalEnergies Price Chart
The TTE D1 price chart shows price action inside a bullish price channel.
It also shows price action between its ascending 0.0% and 38.2% Fibonacci Retracement Fan levels.
The Bull Bear Power Indicator is bullish for most of 2026 but shows a negative divergence.
The average bullish trading volumes are higher than the average bearish trading volumes.
TTE rallied as the CAC 40 Index corrected, a significant bullish trading signal.
My TTE Long Stock Trade
TTE.PA Entry Level: Between €75.91 and €77.41
TTE.PA Take Profit: Between €93.10 and €95.89
TTE.PA Stop Loss: Between €68.05 and €70.50
Risk/Reward Ratio: 2.19
Ready to trade our analysis of TotalEnergies? Here is our list of the best brokers in France worth checking out.