
Short Trade Idea
Enter your short position between €3.69 (the lower band of its horizontal resistance zone) and €3.87 (yesterday’s intra-day high).
Market Index Analysis
Saipem (MIL:SPM) is a member of the FTSE MIB Index.
This index stabilized above its horizontal support zone on low bullish trading volumes.
The Bull Bear Power Indicator for the FTSE MIB Index is bearish with an ascending trendline.
Market Sentiment Analysis
Equity futures are suggesting a bullish start to the session after President Trump noted he considers ending the war in Iran even with the Strait of Hormuz closed. Oil traded mixed as traders awaited more clarity on the reemergence of the TACO trade. On the economic front, Fed Chief Powell suggested inflation remains in check, drawing comparisons to his infamous “inflation is transitory” remarks before it spiked to 40+ year highs. Markets will also receive March consumer confidence and February’s JOLTS data today.
Saipem Fundamental Analysis
Saipem is one of the largest multinational oilfield services companies globally, roughly 30% owned by Eni. It operates through Asset-Based Services, Offshore Drilling, and Energy Carriers segments.
So, why am I bearish on SPM.MI despite its 75%+ rally?
Saipem faced a setback with the cancellation of the agreed acquisition of the Deep Value Driller drill ship, which could have financial and contractual implications and raise legal challenges. I am also bearish on merger risks related to its Subsea 7 merger, which could impact medium-term price action. Margin pressures and project execution risks led to downward earnings-per-share revisions despite stable revenue, a trend the current share price does not reflect.
Metric | Value | Verdict |
P/E Ratio | 23.94 | Bearish |
P/B Ratio | 2.52 | Bearish |
PEG Ratio | 0.37 | Bullish |
Current Ratio | 0.68 | Bearish |
ROIC-WACC Ratio | Negative | Bearish |
Saipem Fundamental Analysis Snapshot
The price-to-earnings (P/E) ratio of 23.94 makes MIL:SPM an expensive stock. By comparison, the P/E ratio for the FTSE MIB Index is 13.38.
The average analyst price target for SPM.MI is €3.74. This suggests no potential with rising downside risks.
Saipem Technical Analysis
Today’s MIL:SPM Signal
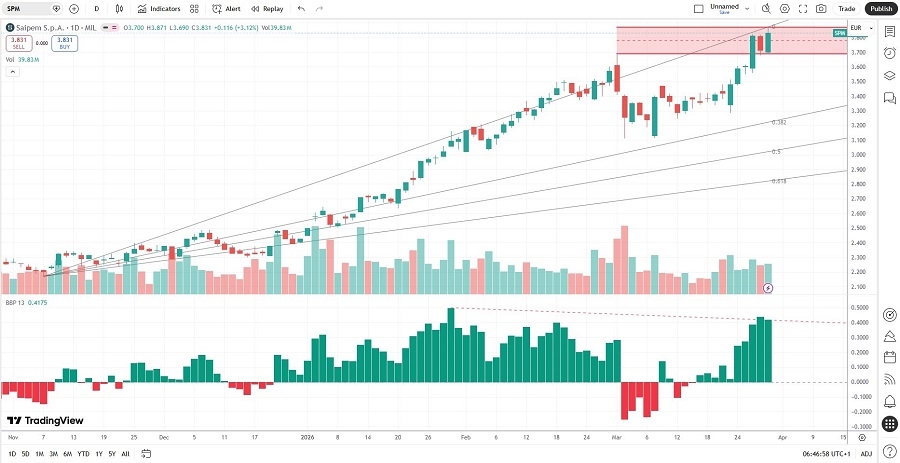
Saipem Price Chart
The SPM D1 chart shows price action inside a horizontal resistance zone.
It also shows price action between its ascending 0.0% and 38.2% Fibonacci Retracement Fan levels.
The Bull Bear Power Indicator is bullish with a negative divergence.
The average bullish trading volumes are higher than the average bearish trading volumes, hinting at more short-term volatility.
SPM.MI outperformed the FTSE MIB Index, a bullish signal, but bearish catalysts are increasing.
My SPM Short Stock Trade
SPM Entry Level: Between €3.69 and €3.87
SPM Take Profit: Between €2.89 and €3.02
SPM Stop Loss: Between €4.06 and €4.19
Risk/Reward Ratio: 2.16
Ready to trade our analysis of Saipem? Here is our list of the best brokers in Italy worth checking out.