
Long Trade Idea
Enter your long position between $136.74 (an intermediate horizontal support level) and $143.91 (Friday’s intra-day high).
Market Index Analysis
Qualcomm (QCOM) is a member of the NASDAQ 100 Index, the S&P 100 Index, and the S&P 500 Index.
All three indices are trading inside bearish price channels.
The Bull Bear Power Indicator of the NASDAQ 100 Index is bearish with a descending trendline.
Market Sentiment Analysis
Equity futures suggest a plunge at the open as markets reassess risk from this weekend’s military action by the US and Israel on Iran. Oil prices spiked during the Asian session amid concerns about the Strait of Hormuz, eclipsing $82 for international Brent Crude before retreating moderately. Iran’s retaliatory strikes may intensify in the coming days. On the economic front, US inflation jumped in January, and all eyes are on Friday’s NFP report. Earnings from Broadcom, Marvell Technology, Target, and Costco will offer more details about the AI trade and the health of consumer spending.
Qualcomm Fundamental Analysis
Qualcomm is a semiconductor and software company catering to wireless technology. It owns patents vital to the 5G, 4G, CDMA2000, TD-SCDMA, and WCDMA mobile communications standards. It has also begun expanding into non-mobile sectors to diversify its business.
So, why am I bullish on QCOM following its breakout?
While Qualcomm reported solid earnings with 5% year-over-year growth and signs of sustainable pricing power, I am the most bullish on its AI200 and AI250 data center chips, which compete with market leaders NVIDIA and AMD. The strategic partnership with Saudi-backed Humain to deploy Qualcomm chips in data centers further strengthens its position in power-efficient AI inference. The Snapdragon X2 Elite and X2 Extreme PC platforms offer promising revenue diversification, adding to my bullish outlook.
Metric | Value | Verdict |
PE Ratio | 28.76 | Bullish |
PB Ratio | 6.58 | Bearish |
PEG Ratio | 0.60 | Bullish |
Current Ratio | 2.51 | Bullish |
ROIC-WACC Ratio | Positive | Bullish |
Qualcomm Fundamental Analysis Snapshot
The price-to-earnings (PE) ratio of 28.76 makes QCOM an inexpensive stock. By comparison, the P/E ratio for the NASDAQ 100 Index is 33.89.
The average analyst price target for QCOM is $161.04. This shows moderate upside potential with manageable downside risks.
Qualcomm Technical Analysis
Today’s QCOM Signal
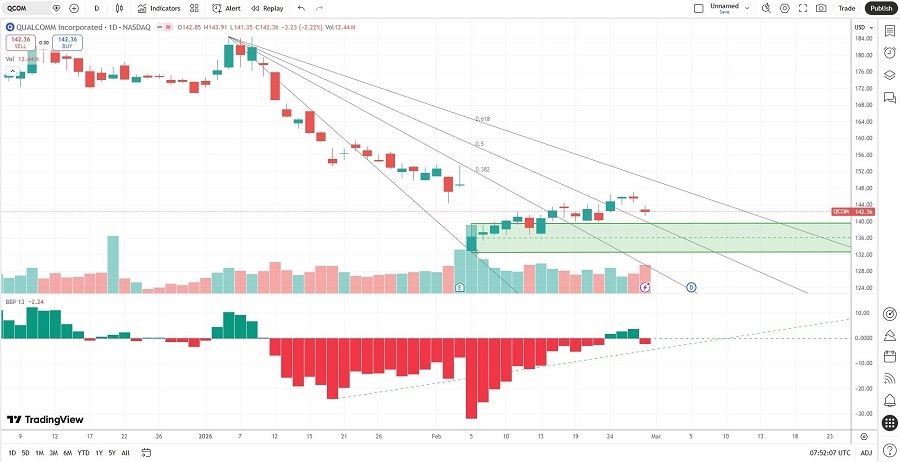
The QCOM D1 chart shows price action breaking out above its horizontal support zone.
It also shows price action between its descending 50.0% and 61.8% Fibonacci Retracement Fan levels.
The Bull Bear Power Indicator turned bearish but remains above its ascending trendline.
The average bullish trading volumes are higher than the average bearish trading volumes.
QCOM moved higher as the NASDAQ 100 Index corrected, a significant bullish confirmation.
My QCOM Long Stock Trade
QCOM Entry Level: Between $136.74 and $143.91
QCOM Take Profit: Between $175.88 and $179.44
QCOM Stop Loss: Between $120.80 and $124.19
Risk/Reward Ratio: 2.46
Ready to trade our analysis of Qualcomm? Here is our list of the best stock brokers worth checking out.