
Long Trade Idea
Enter your long position between $160.58 (yesterday’s intra-day low) and $171.76 (yesterday’s intra-day high).
Market Index Analysis
Oracle (ORCL) is a member of the S&P 100 Index and the S&P 500 Index.
Both indices trade inside bearish chart patterns with rising bearish catalysts.
The Bull Bear Power Indicator of the S&P 500 Index is bearish with a descending trendline.
Market Sentiment Analysis
Equity futures are lower as the announcement to release oil from the US and the IEA's strategic petroleum reserves failed to reverse the rally, which had receded from nearly $120, but has since reversed its slide after two oil tankers were attacked and oil terminals were suspended. Tomorrow’s February PCE will provide another reading on inflation, but before the surge in oil prices. Adobe and Dollar General will report earnings after the bell, potentially injecting volatility into Friday’s session.
Oracle Fundamental Analysis
Oracle is among the 20 largest companies in the world, selling database software, enterprise applications, and cloud infrastructure and hardware. It is also a member of the US-based Stargate joint venture with OpenAI, SoftBank, and MGX.
So, why am I bullish on ORCL following its earnings release?
Oracle reported revenues of $17.19 billion and earnings per share of $1.79, beating estimates of $16.93 billion in revenues and earnings per share of $1.70. I remain bullish due to its improved 2026 and 2027 outlook, while models trained on Oracle Cloud Infrastructure (OCI) with enterprise applications deliver faster, cheaper AI services than rivals. I am equally bullish on its strategic partnerships, including a $300 billion deal with OpenAI, a $5 to $9 billion deal with TikTok's US operations, and a $88 million deal with the US Air Force.
Metric | Value | Verdict |
P/E Ratio | 30.66 | Bearish |
P/B Ratio | 15.65 | Bearish |
PEG Ratio | 1.29 | Bullish |
Current Ratio | 1.35 | Bearish |
ROIC-WACC Ratio | Positive | Bullish |
Oracle Fundamental Analysis Snapshot
The price-to-earning (P/E) ratio of 30.66 makes ORCL an expensive stock. By comparison, the P/E ratio for the S&P 500 Index is 26.81.
The average analyst price target for ORCL is $248.55. This suggests excellent upside potential with acceptable downside risks.
Oracle Technical Analysis
Today’s ORCL Signal
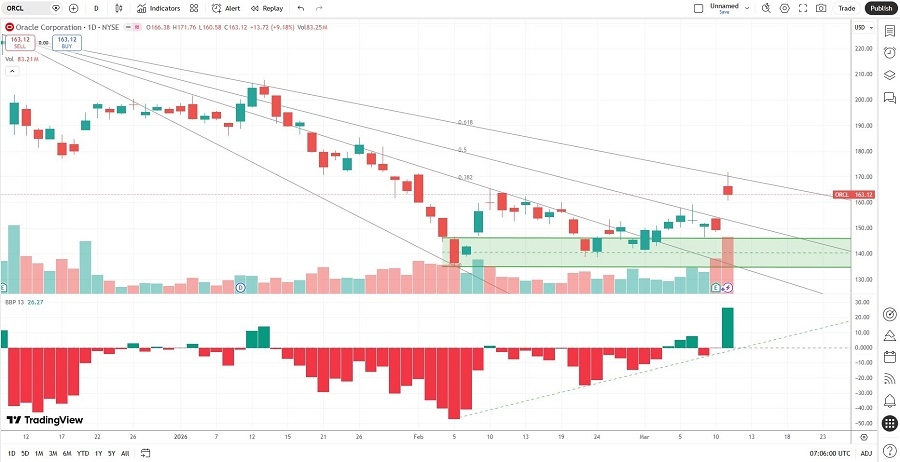
Oracle Price Chart
The ORCL D1 chart shows price action breaking out above its horizontal support zone.
It also shows price action between its descending 50.0% and 61.8% Fibonacci Retracement Fan levels.
The Bull Bear Power Indicator turned bullish with an ascending trendline.
The average bearish trading volumes are higher than average bullish trading volumes, suggesting short-term volatility ahead.
ORCL rallied as the S&P 500 Index moved lower, a significant bullish confirmation.
My ORCL Long Stock Trade
ORCL Entry Level: Between $160.58 and $171.76
ORCL Take Profit: Between $213.62 and $225.32
ORCL Stop Loss: Between $135.25 and $142.10
Risk/Reward Ratio: 2.10
Ready to trade our analysis of Oracle? Here is our list of the best stock brokers worth reviewing.