
The Nasdaq 100 Index bounced back after falling to a low of $24,587 as investors bought the dip after the war in Iran started. It was trading at $25,000, inside the tight range it has remained at in the past few months.
Top Technology Companies to Publish Earnings
The Nasdaq 100 Index dropped initially on Monday as investors reacted to the new war in Iran. It then pared back as investors predicted that there will be a ceasefire in the coming weeks or days.
There are also signs that the US may end its engagement in the near term.Data on Polymarket shows that odds of a ceasefire happening in March have jumped to over 45%.
The next important driver for the Nasdaq 100 Index will be top technology companies like CrowdStrike, Broadcom, Veeva, and Okta. These results will come a week after Nvidia published its results, which showed that earnings and revenue soared in the fourth quarter.
The Nasdaq 100 Index also rose after a report showed that the American economy continued doing well in February. A report released by the Institute of Supply Management (ISM) showed that the manufacturing PMI rose to 52.4 in February.
The index will next react to the upcoming US jobs report, which will provide more information about the state of the economy. Economists polled by Reuters expect the upcoming labor report to show that the labor market softened slightly in February after staging a 100k recovery in February.
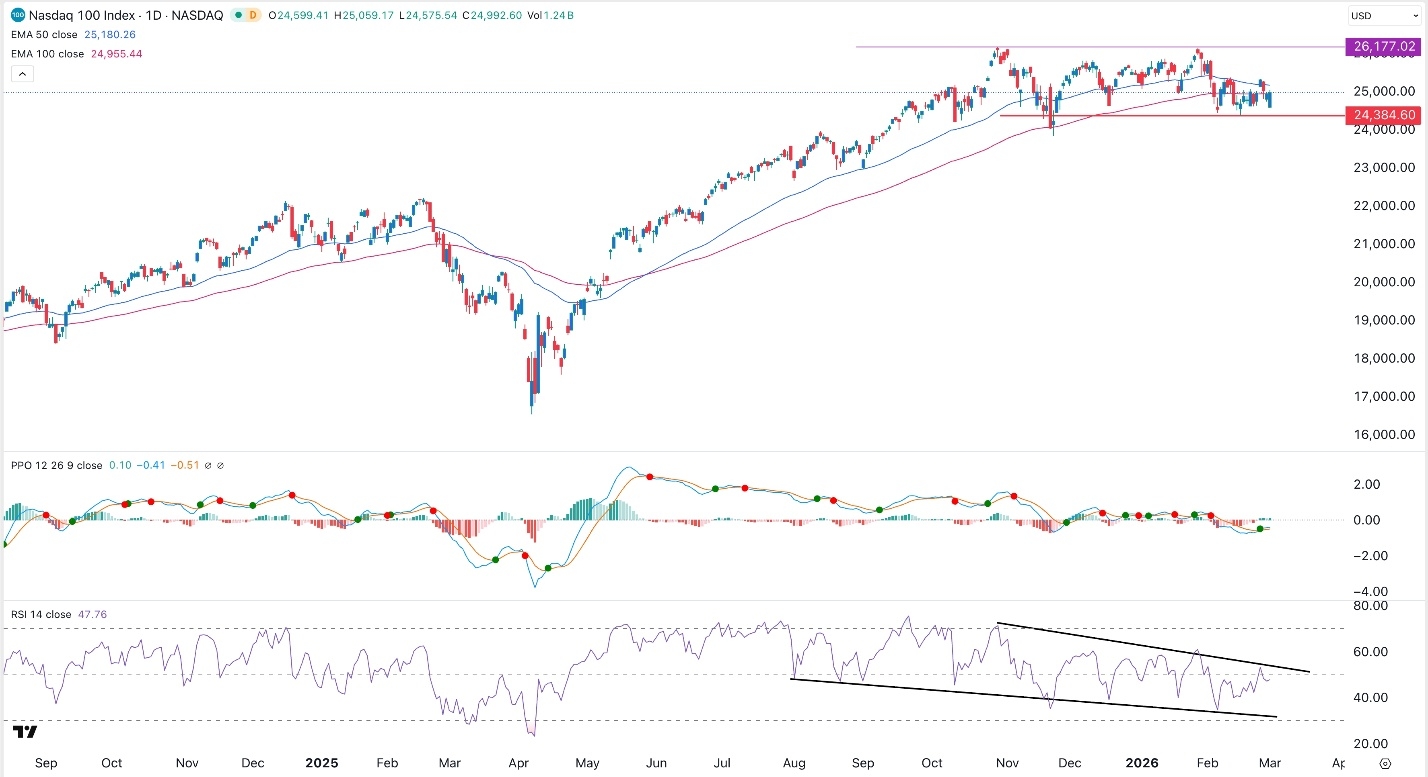
Nasdaq 100 Index Technical Analysis
The daily chart shows that the Nasdaq 100 Index has remained in a tight range in the past few months. It has remained inside the support and resistance levels at $24,385 and $26,177 since October last year.
The Percentage Price Oscillator (PPI) indicator has continued its downtrend since last year and is now below the zero line. Also, the Relative Strength Index (RSI) has formed a bearish divergence pattern, which happens when it is falling as an asset rise.
The index has moved slightly below the 50-day and 100-day Exponential Moving Averages (EMA). Therefore, the most likely Nasdaq 100 Index forecast is where it remains in this range in the near term. A break below the lower side of the channel will point to more downside.
The alternative scenario is where the Nasdaq 100 Index continues rising as bulls target the upper side of the channel at $26,177. A move above that level will point to more gains, potentially to $27,000.