
Long Trade Idea
Enter your long position between $599.01 (yesterday’s intra-day low) and $608.64 (yesterday’s intra-day high).
Market Index Analysis
Meta Platforms (NASDAQ:META) is a member of the NASDAQ 100 Index, the S&P 100 Index, and the S&P 500 Index.
All three indices attempt to stabilize from their recent sell-off, but bullish trading volumes are low.
The Bull Bear Power Indicator for the NASDAQ 100 Index remains bearish with a descending trendline.
Market Sentiment Analysis
Equity futures are lower this morning following yesterday’s rally, sparked by comments from US President Trump that the US and Iran engaged in productive talks over the weekend. He announced a five-day halt on attacks on Iranian oil and energy infrastructure, but Iran denies any talks are taking place. Oil prices resumed their advance, and uncertainty remains, with volatility expected to remain elevated this week. Today’s PMI data and GameStop earnings are also expected today.
Meta Platforms Fundamental Analysis
Meta Platforms is one of the world’s biggest spenders on research & development, a member of the US Big Five Tech Companies, and the Magnificent Seven. It is an industry leader in the metaverse and has now embarked on a hiring spree to become a leader in advanced AI and superintelligence.
So, why am I bullish on META following its 21%+ correction?
I remain bullish on Meta Platforms due to its leadership in digital advertising, driven by AI-driven targeting improvements, higher conversion rates, and higher price-per-click. It helps META fund its superintelligence ambitions and metaverse development, while open-source advancements in Llama reasoning models further boost its competitive edge. Workforce optimization via AI and a 20%+ workforce reduction to offset rising CAPEX is another bullish catalyst.
Metric | Value | Verdict |
P/E Ratio | 25.70 | Bullish |
P/B Ratio | 6.91 | Bearish |
PEG Ratio | 0.97 | Bullish |
Current Ratio | 2.60 | Bullish |
ROIC-WACC Ratio | Positive | Bullish |
Meta Platforms Fundamental Analysis Snapshot
The price-to-earning (P/E) ratio of 25.70 makes META an inexpensive stock. By comparison, the P/E ratio for the NASDAQ 100 Index is 35.41.
The average analyst price target for META is $863.63. This suggests there is excellent upside potential with decreasing downside risks.
Meta Platforms Technical Analysis
Today’s META Signal
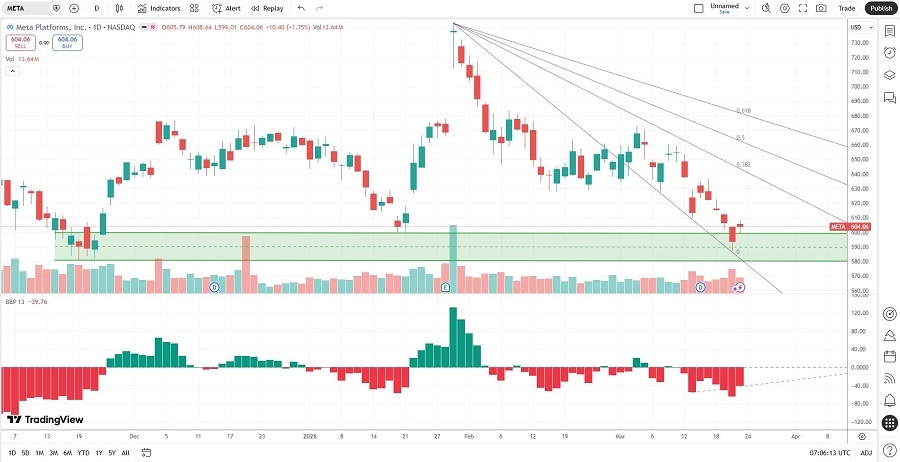
Meta Platforms Price Chart
The META D1 chart shows price action breaking out above its horizontal support zone.
It also shows price action between its descending 0.0% and 38.2% Fibonacci Retracement Fan levels.
The Bull Bear Power Indicator is bearish with a positive divergence.
The average bearish trading volumes are higher than the average bullish trading volumes, hinting at more short-term volatility.
META corrected with the NASDAQ 100 Index, a bearish confirmation, but bullish catalysts are accumulating.
My META Long Stock Trade
META Entry Level: Between $599.01 and $608.64
META Take Profit: Between $690.51 and $712.55
META Stop Loss: Between $553.30 and $570.50
Risk/Reward Ratio: 2.00
Ready to trade our analysis of META? Here is our list of the best stock brokers worth checking out.