
Long Trade Idea
Enter your long position between $176.09 (the intra-day low from its last bullish candlestick) and $181.00 (yesterday’s intra-day high).
Market Index Analysis
Leidos Holdings (LDOS) is a member of the S&P 500 Index.
This index trades inside a bearish chart pattern, recording lower lows and lower highs.
The Bull Bear Power Indicator of the S&P 500 Index is bearish with a descending trendline.
Market Sentiment Analysis
Equity markets rose yesterday amid optimism for a swift end to the Iran war after reports surfaced that Iran’s Ministry of Intelligence reached out to the US CIA via a third spy agency. Washington remains skeptical of the intentions, while analysts caution that the approach was adopted soon after the war began. Still, the news sufficed to rally markets, boosted by better-than-expected ADP payroll data. Equity futures are suggesting another sell-off at the start, with developments from Iran driving price action. Earnings from Costco and Marvell Technology will be released after the bell, and investors await February’s NFP report on Friday before the open.
Leidos Holdings Fundamental Analysis
Leidos Holdings (LDOS) is a defense, aviation, information technology, and biomedical research company. LDOS is the largest government IT company and has contracts with the Department of Defense, the Department of Homeland Security, the Intelligence Community, and select commercial markets.
So, why am I bullish on LDOS after its recent breakout?
The $49 billion backlog, the $20 billion bid pipeline, the $2.4 billion ENTRUST Solutions acquisition, and the Trump executive order favoring US space leadership drive my bullishness in Leidos. High revenue visibility from contracts such as the $561 million defense data IDIQ and the $2.2 billion ABADS-MD contract supports future revenue growth. I am equally bullish about its strategic opportunities, enabled by its 2025 free cash flow of $1.6 billion.
Metric | Value | Verdict |
P/E Ratio | 15.88 | Bullish |
P/B Ratio | 4.64 | Bearish |
PEG Ratio | 2.46 | Bullish |
Current Ratio | 1.70 | Bearish |
ROIC-WACC Ratio | Positive | Bullish |
Leidos Holdings Fundamental Analysis Snapshot
The price-to-earnings (P/E) ratio of 15.88 makes LDOS an inexpensive stock. By comparison, the P/E ratio for the S&P 500 Index is 28.98.
The average analyst price target for LDOS is $214.00. This suggests an excellent upside potential with manageable downside risk.
Leidos Holdings Technical Analysis
Today’s LDOS Signal
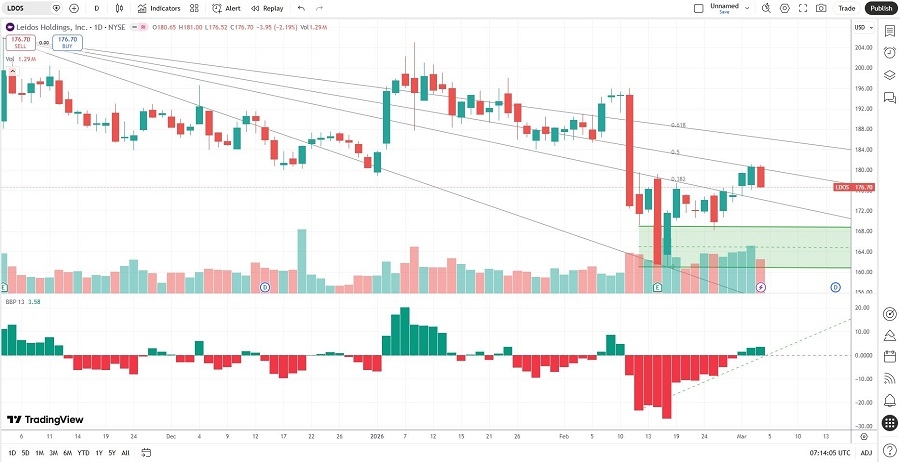
Leidos Holdings Price Chart
The LDOS D1 chart shows price action breaking out above its horizontal support zone.
It also shows price action trading between its descending 38.2% and 50.0% Fibonacci Retracement Fan levels.
The Bull Bear Power Indicator is bullish with an ascending trendline.
The average bullish trading volumes are higher than the average bearish trading volumes.
LDOS outperformed the S&P 500 Index during the recent volatility, a significant bullish confirmation.
My LDOS Long Stock Trade
LDOS Entry Level: Between $176.09 and $181.00
LDOS Take Profit: Between $209.72 and $214.00
LDOS Stop Loss: Between $161.05 and $164.15
Risk/Reward Ratio: 2.24
Ready to trade our analysis of Leidos Holdings? Here is our list of the best stock brokers worth reviewing.