
Short Trade Idea
Enter your short position between $25.85 (the intra-day low of its last bullish candlestick) and $26.44 (yesterday’s intra-day high).
Market Index Analysis
Invitation Homes (NYSE:INVH) is a member of the S&P 500 Index.
This index trades inside a bearish chart pattern with rising bearish trading volumes.
The Bull Bear Power Indicator of the S&P 500 Index is bearish with a descending trendline.
Market Sentiment Analysis
Equity markets plunged yesterday but recovered during the sessions as investors bought the dip. Equity futures suggest another plunge this morning, as the war with Iran escalates, and President Trump promised the most significant wave of attacks is yet to happen. Iran warned that the Strait of Hormuz is closed, and that any ship that attempts to cross it would be attacked. However, 30% of the usual traffic is still getting through. Nevertheless, energy prices are rising, which could spike inflation and sink the global economy into a recession if the war lasts longer than feared. Earnings from Target will offer a snapshot of consumer health, and volatility should remain elevated.
Invitation Homes Fundamental Analysis
Invitation Homes (INVH) is a REIT with over 86,000 single-family homes in 16 markets. Since 2017, it has been the most prominent US owner of single-family homes in the upper end of the market, with average tenant household income of approximately $100,000.
So, why am I bearish on INVH following its earnings report?
While the earnings report was mixed, I am bearish amid a proposed federal ban on institutional single-family rental (SFR) ownership, which could deprive INVH of future investment opportunities. Weakening fundamentals and price target downgrades reflect skepticism about its 2026 outlook. Despite rising rents, the 2026 outlook was muted, and Invitation Homes underperforms its peers. Affordability issues from a weakening consumer remain, and interest rates may have bottomed out in the current cycle.
Metric | Value | Verdict |
P/E Ratio | 27.24 | Bearish |
P/B Ratio | 1.68 | Bullish |
PEG Ratio | 12.92 | Bearish |
Current Ratio | 2.42 | Bullish |
ROIC-WACC Ratio | Negative | Bearish |
Invitation Homes Fundamental Analysis Snapshot
The price-to-earnings (P/E) ratio of 27.24 makes INVH an expensive REIT. By comparison, the P/E ratio for the S&P 500 Index is 29.57.
The average analyst price target for INVH is $31.71. This suggests there is moderate upside potential, but downside risks are rising.
Invitation Homes Technical Analysis
Today’s INVH Signal
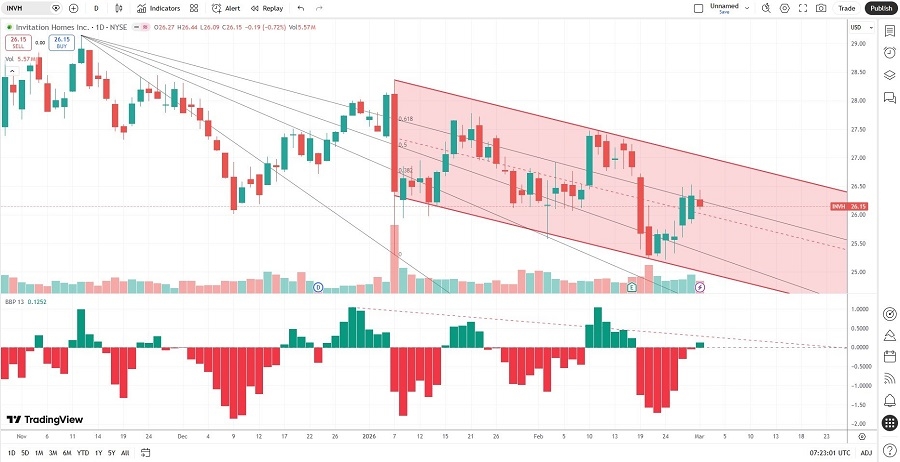
Invitation Homes Price Chart
The INVH D1 chart shows price action inside a bearish price channel.
It also shows price action between its descending 50.0% and 61.8% Fibonacci Retracement Fan levels.
The Bull Bear Power Indicator turned bullish but remains below its descending trendline.
The average bearish trading volumes are higher than the average bullish trading volumes.
INVH is descending more steeply than the S&P 500 Index, which is a significant bearish trading signal.
My INVH Short Stock Trade
INVH Entry Level: Between $25.85 and $26.44
INVH Take Profit: Between $21.53 and $22.60
INVH Stop Loss: Between $27.78 and $29.14
Risk/Reward Ratio: 2.24
Ready to trade our analysis of Invitation Homes? Here is our list of the best stock brokers worth reviewing.