
Short Trade Idea
Enter your short position between $41.64 (the last time price action touched the lower band of its bearish price channel) and $44.13 (Friday’s intra-day high).
Market Index Analysis
Intel (NASDAQ:INTC) is a member of the NASDAQ 100 Index, the Dow Jones Industrial Average Index, the S&P 100 Index, and the S&P 500 Index.
All four indices trade at or near 2026 lows with accumulating bearish catalysts.
The Bull Bear Power Indicator for the NASDAQ 100 Index is bearish with a descending trendline.
Market Sentiment Analysis
Equity futures are moderately higher this morning following last week’s steep selloff that dropped equity markets to 2026 lows. Investors might now bet on the TACO trade to emerge as the global economy is facing the consequences of President Trump’s foreign policy, pressuring his core voter base ahead of the mid-term elections. The Magnificent Seven lost over $850 billion in market value last week, but the focus will shift to labor market data in this holiday-shortened week.
Intel Fundamental Analysis
Intel is a technology company that primarily designs CPUs for business and consumer markets. It lost its leadership position to AMD and missed out on the AI wave, while its future chips will rely heavily on TSMC.
So, why am I bearish on INTC amid its 21%+ correction?
Intel suffers from mounting foundry losses with no visible path to profitability, after posting losses exceeding $10 billion in 2025. Yields on the 18A process node are below target, and the 14A node rollout remains delayed, as it depends on securing anchor customers, of which Intel has zero in 2026. Intel is losing market share to AMD, and its Gaudi chips have negligible traction.
Metric | Value | Verdict |
P/E Ratio | 89.23 | Bearish |
P/B Ratio | 1.92 | Bullish |
PEG Ratio | 0.50 | Bullish |
Current Ratio | 2.02 | Bullish |
ROIC-WACC Ratio | Negative | Bearish |
Intel Fundamental Analysis Snapshot
The price-to-earning (P/E) ratio of 89.23 makes INTC an expensive stock. By comparison, the P/E ratio for the NASDAQ 100 Index is 33.87.
The average analyst price target for INTC is $47.11. This suggests limited upside potential with rising downside risks.
Intel Technical Analysis
Today’s INTC Signal
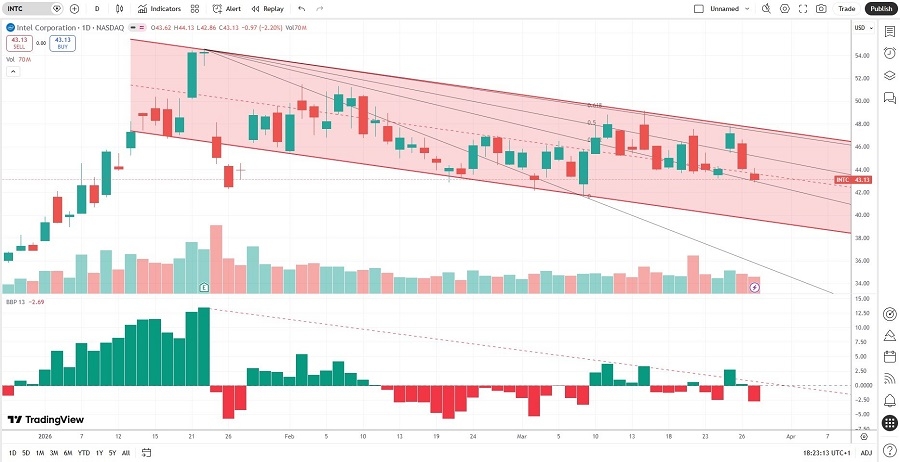
Intel Price Chart
The INTC D1 chart shows price action inside a bearish price channel.
It also shows price action between its descending 38.2% and 50.0% Fibonacci Retracement Fan levels.
The Bull Bear Power Indicator is bearish with a descending trendline.
The average bearish trading volumes are higher than the average bullish trading volumes.
INTC corrected with the NASDAQ 100 Index, a bearish trading confirmation.
My INTC Short Stock Trade
INTC Entry Level: Between $41.64 and $44.13
INTC Take Profit: Between $28.73 and $30.57
INTC Stop Loss: Between $47.11 and $49.17
Risk/Reward Ratio: 2.36
Ready to trade our analysis of Intel? Here is our list of the best stock brokers worth checking out.