
Long Trade Idea
Enter your long position between $78.57 (the intra-day low of its last bearish candlestick) and $82.16 (yesterday’s intra-day high).
Market Index Analysis
GoDaddy (NYSE:GDDY) is a member of the S&P 500 Index.
This index continues to record fresh 2026 lows amid growing uncertainty.
The Bull Bear Power Indicator for the S&P 500 Index is bearish with a descending trendline.
Market Sentiment Analysis
Equity futures are suggesting a bullish start to the session after President Trump noted he considers ending the war in Iran even with the Strait of Hormuz closed. Oil traded mixed as traders awaited more clarity on the reemergence of the TACO trade. On the economic front, Fed Chief Powell suggested inflation remains in check, drawing comparisons to his infamous “inflation is transitory” remarks before it spiked to 40+ year highs. Markets will also receive March consumer confidence and February’s JOLTS data today.
GoDaddy Fundamental Analysis
GoDaddy is the world’s fifth-largest web hosting company with over 20M+ customers. It focuses on micro and small companies.
So, why am I bullish on GDDY at current levels?
Despite mounting legal scrutiny following its last earnings release due to inadequate disclosure of risks tied to promotional pricing strategies, I am cautiously bullish amid low valuations, rising trading volumes at solid support levels, and strong free cash flow. Its AI-driven Airo platform remains mispriced and should offer a core differentiator from competitors. The options market shows a put/call ratio of 0.43, suggesting significantly more bullish calls than bearish puts. I am equally bullish on GoDaddy’s margin expansion and strategic partnerships like Salesforce’s MuleSoft.
Metric | Value | Verdict |
P/E Ratio | 13.14 | Bullish |
P/B Ratio | 52.63 | Bearish |
PEG Ratio | 0.68 | Bullish |
Current Ratio | 0.62 | Bearish |
ROIC-WACC Ratio | Positive | Bullish |
GoDaddy Fundamental Analysis Snapshot
The price-to-earnings (P/E) ratio of 13.14 makes GDDY an inexpensive stock. By comparison, the P/E ratio for the S&P 500 Index is 25.24.
The average analyst price target for GDDY is $117.67. This suggests there is excellent upside potential with acceptable downside risks.
GoDaddy Technical Analysis
Today’s GDDY Signal
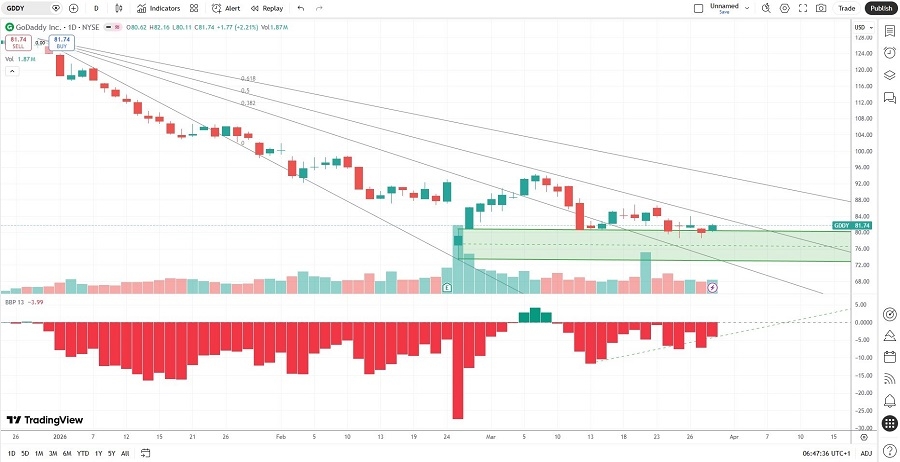
GoDaddy Price Chart
The GDDY D1 chart shows price action breaking out above a horizontal support zone.
It also shows price action between its descending 38.2% and 50.0% Fibonacci Retracement Fan levels.
The Bull Bear Power Indicator is bearish with a positive divergence.
The average bullish trading volumes are higher than the average bearish trading volumes.
GDDY is drifting higher as the S&P 500 Index moves lower, a bullish confirmation.
My GDDY Long Stock Trade
GDDY Entry Level: Between $78.57 and $82.16
GDDY Take Profit: Between $98.81 and $102.14
GDDY Stop Loss: Between $69.41 and $71.15
Risk/Reward Ratio: 2.21
Ready to trade our analysis of GoDaddy? Here is our list of the best stock brokers worth reviewing.