
Short Trade Idea
Enter your short position between 215.01 (yesterday’s intra-day low) and 224.22 (yesterday’s intra-day high).
Market Index Analysis
Generac Holdings (GNRC) is a member of the S&P 500 Index.
This index trades inside a bearish chart pattern with rising downside catalysts.
The Bull Bear Power Indicator of the S&P 500 is bearish with a descending trendline.
Market Sentiment Analysis
Equity markets sold off for a second day to start the session but closed the day notably off session lows as the Iran war concluded its fourth day. Yesterday’s rally was sparked after US President Trump announced the US would extend insurance to tankers passing through the Strait of Hormuz and provide military escorts to protect them against attacks. Equity futures are pointing to another sell-off this morning, as the war enters its fifth day. Today’s ADP report could inject volatility ahead of Friday’s NFP report. Earnings season is quieting down, but releases from Broadcom, Costco, and Alibaba will offer crucial insights into the AI trade and into consumer spending.
Generac Holdings Fundamental Analysis
Generac Holdings is a Fortune 1000 American manufacturer of residential, light commercial, and industrial power systems with outputs ranging from 800 watts to 9 megawatts.
So, why am I bearish on GNRC following its earnings miss?
Generac Holdings missed on both revenue and EPS, and the rally reinforced my bearish stance driven by valuation and profitability concerns. Competition from Caterpillar and Cummins, which benefit from well-established relationships with hyperscalers, remains intense, and I question GNRC’s ability to reach $500 million in annual data center sales. Weakening residential demand adds another red flag, while its Commercial & Industrial (C&I) unit continues to underperform.
Metric | Value | Verdict |
P/E Ratio | 81.93 | Bearish |
P/B Ratio | 5.14 | Bearish |
PEG Ratio | 1.11 | Bullish |
Current Ratio | 2.03 | Bullish |
ROIC-WACC Ratio | Positive | Bullish |
Generac Holdings Fundamental Analysis Snapshot
The price-to-earnings (P/E) ratio of 81.93 makes GNRC an expensive stock. By comparison, the P/E ratio for the S&P 500 Index is 28.69.
The average analyst price target for GNRC is $241.65. This suggests moderate upside potential, but downside risks are rising faster.
Generac Holdings Technical Analysis
Today’s GNRC Signal
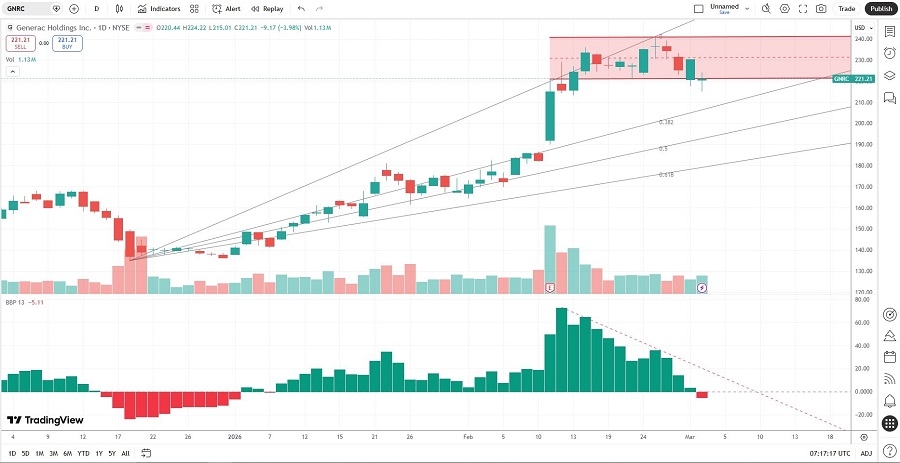
Generac Holdings Price Chart
The GNRC D1 chart shows a price action breaking down below its horizontal resistance zone.
It also shows price action between its ascending 0.0% and 38.2% Fibonacci Retracement Fan levels.
The Bull Bear Power Indicator turned bearish with a descending trendline.
The average bullish trading volumes have been decreasing since the latest earnings release.
GNRC corrected by less than the S&P 500 Index, a bullish trading signal, but breakdown catalysts are accumulating.
My GNRC Short Stock Trade
GNRC Entry Level: Between $215.01 and $224.22
GNRC Take Profit: Between $166.00 and $175.88
GNRC Stop Loss: Between $236.82 and $241.65
Risk/Reward Ratio: 2.25
Ready to trade our analysis of Generac Holdings? Here is our list of the best stock brokers worth checking out.