
Short Trade Idea
Enter your short position between $82.20 (yesterday’s intra-day low) and $83.56 (an intermediate horizontal resistance level).
Market Index Analysis
Fortinet (NASDAQ:FTNT) is a member of the NASDAQ 100 Index and the S&P 500 Index.
Both indices trade inside bearish price channels with rising bearish trading volumes.
The Bull Bear Power Indicator for the NASDAQ 100 Index turned bearish and remains below its descending trendline.
Market Sentiment Analysis
Equity futures are drifting lower following yesterday’s slump that sent the Dow Jones Industrial Average to a fresh 2026 low after surging PPI inflation in February, before oil prices spiked over 50%+ due to the Iran war. Still, Fed Chair Powell dismissed stagflation concerns, calling it a term from the 1970s. Micron shares fell after the market closed despite a stellar earnings report, while Alibaba and FedEx will report earnings today.
Fortinet Fundamental Analysis
Fortinet is a cybersecurity company with offices in dozens of countries. It ranks among the top-rated large-cap growth stocks and expands its market share via acquisitions.
So, why am I bearish on FTNT despite its recent counter-market rally?
Fortinet faces increasing margin pressures from rising costs stemming from high memory prices, currency exchange risks from its global clients, and competitive risks. Hardware costs are applying downside pressures on net profits, and valuations are high. The industry also suffers from a talent shortage. I am also bearish on rapid advancements in AI and cybersecurity, which could render Fortinet less competitive and decrease its pricing power. FTNT also noted reduced IT spending, global conflicts, and supply chain challenges in its latest investor materials.
Metric | Value | Verdict |
P/E Ratio | 34.46 | Bearish |
P/B Ratio | 49.72 | Bearish |
PEG Ratio | 2.13 | Bullish |
Current Ratio | 1.17 | Bearish |
ROIC-WACC Ratio | Positive | Bullish |
Fortinet Fundamental Analysis Snapshot
The price-to-earnings (P/E) ratio of 34.46 makes FTNT a relatively expensive stock. By comparison, the P/E ratio for the NASDAQ 100 Index is 35.75.
The average analyst price target for FTNT is $89.06. It suggests negligible upside potential with heightened downside risks.
Fortinet Technical Analysis
Today’s FTNT Signal
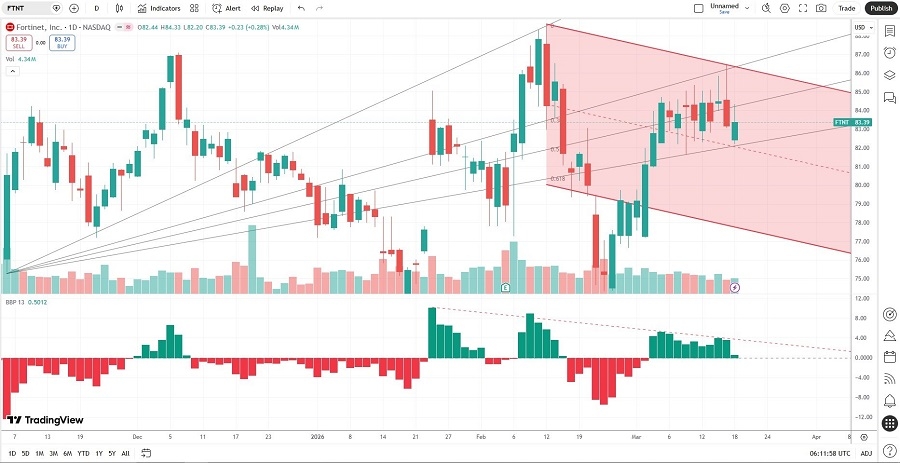
Fortinet Price Chart
The FTNT D1 chart shows price action inside a bearish price channel.
It also shows price action between its ascending 50.0% and 61.8% Fibonacci Retracement Fan levels.
The Bull Bear Power Indicator is bullish with a descending trendline.
The average bullish trading volumes are higher than the average bearish trading volumes, suggesting more short-term volatility.
FTNT corrected less than the NASDAQ 100 Index, a bullish trading signal, but bearish catalysts are accumulating.
My FTNT Short Stock Trade
FTNT Entry Level: Between $82.20 and $83.56
FTNT Take Profit: Between $66.19 and $67.97
FTNT Stop Loss: Between $89.06 and $90.84
Risk/Reward Ratio: 2.33
Ready to trade our analysis of Fortinet? Here is our list of the best stock brokers worth reviewing.