
Short Trade Idea
Enter your short position between $45.60 (yesterday’s intra-day low) and $46.68 (yesterday’s intra-day high).
Market Index Analysis
Fastenal (FAST) is a member of the NASDAQ 100 Index and the S&P 500 Index.
Both indices trade inside bearish chart patterns with rising bearish catalysts.
The Bull Bear Power Indicator of the S&P 500 Index is bearish with a descending trendline.
Market Sentiment Analysis
Equity futures are lower as the announcement to release oil from the US and the IEA's strategic petroleum reserves failed to reverse the rally, which had receded from nearly $120, but has since reversed its slide after two oil tankers were attacked and oil terminals were suspended. Tomorrow’s February PCE will provide another reading on inflation, but before the surge in oil prices. Adobe and Dollar General will report earnings after the bell, potentially injecting volatility into Friday’s session.
Fastenal Fundamental Analysis
Fastenal is an industrial supply and stock-keeping unit with over 690,000 items. It refers to itself as a supply chain solutions company. It primarily caters to the construction and manufacturing sectors.
So, why am I bearish on FAST after its breakdown?
Fastenal has overshot its average analyst price target, but my bearishness stems from ongoing margin pressure and its reliance on manufacturing, construction, and industrial activity, which are slowing down. Tariffs and supply chain risks remain, and the leadership transition adds to medium-term uncertainty. Adding to bearish catalysts is the latest average order value data, which confirms a slowdown in customer spending, declining to $216 from $224.
Metric | Value | Verdict |
P/E Ratio | 42.74 | Bearish |
P/B Ratio | 13.57 | Bearish |
PEG Ratio | 3.39 | Bearish |
Current Ratio | 4.85 | Bullish |
ROIC-WACC Ratio | Positive | Bullish |
Fastenal Fundamental Analysis Snapshot
The price-to-earning (P/E) ratio of 42.74 indicates FAST is an expensive stock. By comparison, the P/E ratio for the S&P 500 Index is 26.81.
The average analyst price target for FAST is $45.15. This suggests there is no upside potential, while downside risks dominate.
Fastenal Technical Analysis
Today’s FAST Signal
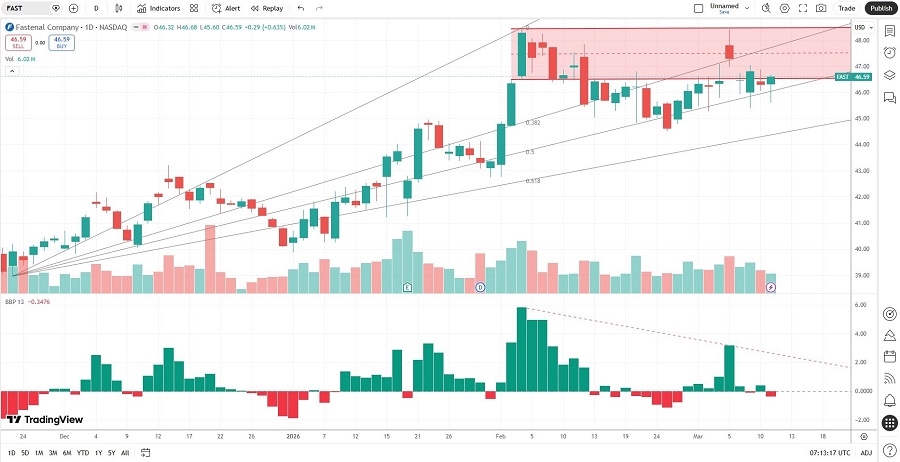
Fastenal Price Chart
The FAST D1 chart shows price action breaking down below its horizontal resistance zone.
It also shows price action between its ascending 38.2% and 50.0% Fibonacci Retracement Fan levels.
The Bull Bear Power Indicator turned bearish with a descending trendline.
The average bullish trading volumes are higher than the average bearish trading volumes, hinting at short-term volatility.
FAST corrected less than the S&P 500 Index, a bullish confirmation, but bearish catalysts are rising.
My FAST Short Stock Trade
FAST Entry Level: Between $45.60 and $46.68
FAST Take Profit: Between $38.97 and $40.25
FAST Stop Loss: Between $48.90 and $50.37
Risk/Reward Ratio: 2.01
Ready to trade our analysis of Fastenal? Here is our list of the best stock brokers worth reviewing.