
Short Trade Idea
Enter your short position between $81.71 (yesterday’s intra-day low) and $83.36 (yesterday’s intra-day high).
Market Index Analysis
Evergy (EVRG) is a member of the S&P 500 Index.
This index moves lower inside a bearish chart pattern with rising bearish trading volumes.
The Bull Bear Power Indicator of the S&P 500 Index is bearish with a descending trendline.
Market Sentiment Analysis
Equity futures are lower this morning following yesterday’s volatile session that saw markets plunge at the open as oil prices soared to nearly $120 per barrel before mounting a massive reversal amid comments by President Trump that the Itan war is nearing its end, which sent oil prices tumbling below $90 per barrel. Stagflation concerns are rising, and markets will parse through tomorrow’s CPI and Friday’s PCI reports. China’s exports surged despite Trump’s tariffs, while Oracle’s earnings today and Adobe’s on Thursday will be the next catalysts for the AI trade.
Evergy Fundamental Analysis
Evergy (EVRG) is an investor-owned utility (IOU) and the largest electric company in Kansas with over 1.7 million customers in Kansas and Missouri. It generates over 16,000 megawatt-hours of electricity from over 40 power plants.
So, why am I bearish on EVRG after its earnings miss?
I am bearish on Evergybecause valuations are too high for a company that missed on the top and bottom lines of its earnings release, cut its 2026 guidance, and faces rising interest expenses despite lower borrowing costs. I am also bearish about its dismal return on equity, given that its debt-to-asset ratio is rising. The advance since its earnings miss, driven by hopes of capitalizing on data center demand and grid modernization, remains stretched, with no short- to medium-term upside catalysts.
Metric | Value | Verdict |
P/E Ratio | 22.71 | Bearish |
P/B Ratio | 1.88 | Bullish |
PEG Ratio | 2.70 | Bearish |
Current Ratio | 0.49 | Bearish |
ROIC-WACC Ratio | Negative | Bearish |
Evergy Fundamental Analysis Snapshot
The price-to-earnings (P/E) ratio of 22.71 makes EVRG an expensive utility. By comparison, the P/E ratio for the S&P 500 Index is 26.29.
The average analyst price target for EVRG is $87.50. This suggests there is limited upside potential with elevated downside risks.
Evergy Technical Analysis
Today’s EVRG Signal
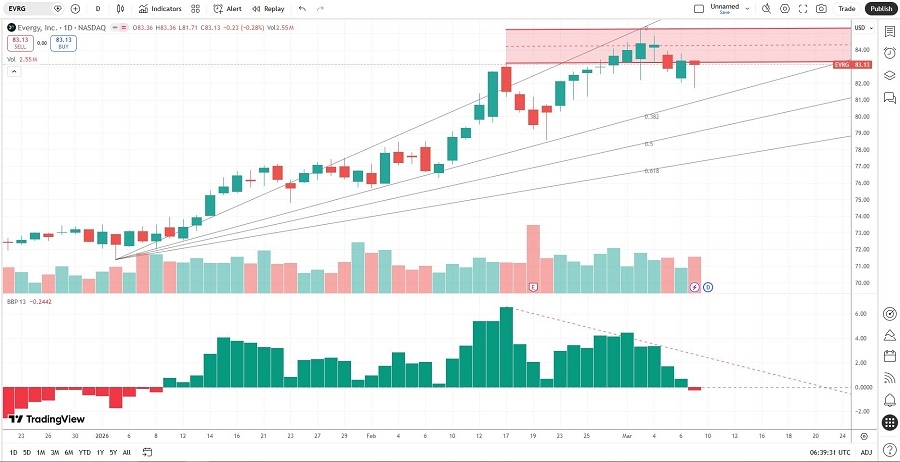
Evergy Price Chart
The EVRG D1 chart shows price action breaking down below its horizontal resistance zone.
It also shows price action between its ascending 0.0% and 38.2% Fibonacci Retracement Fan levels.
The Bull Bear Power Indicator turned bearish with a descending trendline.
The average bullish trading volumes are higher than the average bearish trading volumes, suggesting more short-term volatility ahead.
EVRG corrected by less than the S&P 500 Index, a bullish signal, but downside catalysts are rising.
My EVRG Short Stock Trade
EVRG Entry Level: Between $81.71 and $83.36
EVRG Take Profit: Between $71.41 and $73.95
EVRG Stop Loss: Between $85.23 and $87.50
Risk/Reward Ratio: 2.07
Ready to trade our analysis of Evergy? Here is our list of the best stock brokers worth reviewing.