
Short Trade Idea
Enter your short position between €9.50 (yesterday’s intra-day low) and €9.76 (an intermediate horizontal resistance level).
Market Index Analysis
Enel (BIT:ENEL) is a member of the FTSE MIB Index.
This index trades inside a bearish price channel with rising bearish trading volumes.
The Bull Bear Power Indicator for the FTSE MIB Index turned bullish but remains below its descending trendline.
Market Sentiment Analysis
Equity futures are drifting lower following yesterday’s slump that sent the Dow Jones Industrial Average to a fresh 2026 low after surging PPI inflation in February, before oil prices spiked over 50%+ due to the Iran war. Still, Fed Chair Powell dismissed stagflation concerns, calling it a term from the 1970s. Micron shares fell after the market closed despite a stellar earnings report, while Alibaba and FedEx will report earnings today.
Enel Fundamental Analysis
Enel is a utility company that produces and distributes electricity and gas in 28 countries across Europe, North America, South America, Asia, and Africa. It is the largest energy company in Europe by customers and the second by capacity, with 61 million customers and a net installed generating capacity of 88 GW.
So, why am I bearish on ENEL.MI ahead of its earnings release?
I am bearish on Enel following last month’s Italian Energy Decree, which stripped carbon costs from electricity bills. I expect margin compression due to an expected 15% drop in electricity prices. ENEL.MI missed its previous earnings estimates, which it could repeat today, and I am wary of its €53 billion spending plan given the current economic backdrop. Debt risks are elevated, and current valuations remain excessive amid deteriorating earnings potential.
Metric | Value | Verdict |
P/E Ratio | 15.97 | Bearish |
P/B Ratio | 2.82 | Bearish |
PEG Ratio | 8.31 | Bearish |
Current Ratio | 0.82 | Bearish |
ROIC-WACC Ratio | Negative | Bearish |
Enel Fundamental Analysis Snapshot
The price-to-earnings (P/E) ratio of 15.97 makes ENEL.MI an expensive stock. By comparison, the P/E ratio for the FTSE MIB Index is 13.64.
The average analyst price target for ENEL.MI is €9.85. This suggests there is no upside potential but there are rising downside risks.
Enel Technical Analysis
Today’s ENEL Signal
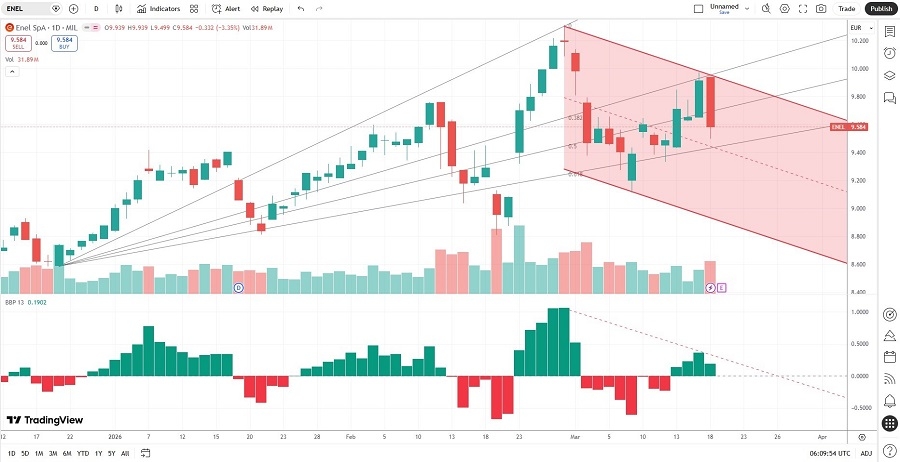
Enel Price Chart
The ENEL D1 chart shows price action inside a bearish price channel.
It also shows price action between its ascending 50.0% and 61.8% Fibonacci Retracement Fan levels.
The Bull Bear Power Indicator is bullish but remains below its descending trendline.
The average bearish trading volumes are higher than the average bullish trading volumes.
ENEL.MI corrected with the FTSE MIB Index, a bearish trading signal.
My ENEL Short Stock Trade
ENEL.MI Entry Level: Between €9.50 and €9.76
ENEL.MI Take Profit: Between €8.05 and €8.19
ENEL.MI Stop Loss: Between €10.14 and €10.31
Risk/Reward Ratio: 2.27
Ready to trade our analysis of ENEL? Here is our list of the best brokers in Italy worth checking out.