
Short Trade Idea
Enter your short position between $1,007.38 (the intra-day low of its last bearish candlestick) and $1,033.38 (an intermediate horizontal support level).
Market Index Analysis
Eli Lilly and Company (LLY) is a member of the S&P 100 Index and the S&P 500 Index.
Both indices are trading inside bearish price channels.
The Bull Bear Power Indicator of the S&P 500 Index is bearish with a descending trendline.
Market Sentiment Analysis
Equity futures suggest a plunge at the open as markets reassess risk from this weekend’s military action by the US and Israel on Iran. Oil prices spiked during the Asian session amid concerns about the Strait of Hormuz, eclipsing $82 for international Brent Crude before retreating moderately. Iran’s retaliatory strikes may intensify in the coming days. On the economic front, US inflation jumped in January, and all eyes are on Friday’s NFP report. Earnings from Broadcom, Marvell Technology, Target, and Costco will offer more details about the AI trade and the health of consumer spending.
Eli Lilly and Company Fundamental Analysis
Eli Lilly and Company is a pharmaceutical company with offices in 18 countries. ELY is the most valuable pharmaceutical company worldwide and the 11th-largest biomedical company by revenue.
So, why am I bearish on LLY following its earnings report?
The approval of Olumiant for extended use in the EU is a short-term bullish catalyst, but it is insufficient to counter growing competition in the GLP-1 market. Novo Nordisk secured a 71% discount on its drugs for Medicare, adding price pressures on Eli Lilly to lower costs, which will hurt revenue and earnings. Gastrointestinal side effects are leading to higher dropout rates for its GLP-1 treatment. While the $50 billion manufacturing expansion was necessary, it is adding to medium-term financial strains, and valuations remain excessive.
Metric | Value | Verdict |
P/E Ratio | 45.88 | Bearish |
P/B Ratio | 37.40 | Bearish |
PEG Ratio | 1.13 | Bullish |
Current Ratio | 1.58 | Bearish |
ROIC-WACC Ratio | Positive | Bullish |
Eli Lilly and Company Fundamental Analysis Snapshot
The price-to-earning (P/E) ratio of $45.88 makes LLY an expensive stock. By comparison, the P/E ratio for the S&P 500 Index is $29.55.
The average analyst price target for LLY is $1,214.34. This suggests there is some excellent upside potential, but downside risks remain greater.
Eli Lilly and Company Technical Analysis
Today’s LLY Signal
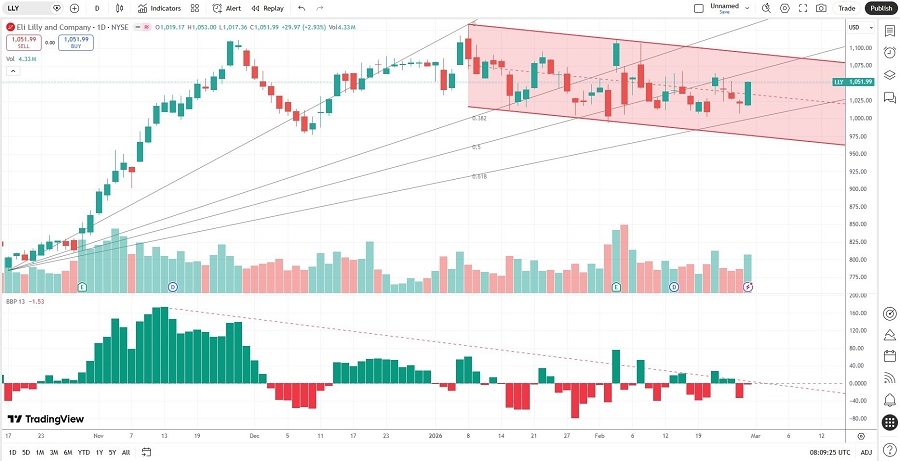
Eli Lilly Price Chart
The LLY D1 chart shows price action inside a bearish price channel.
It also shows price action breaking between its ascending 50.0% and 61.8% Fibonacci Retracement Fan level.
The Bull Bear Power Indicator turned bearish with a descending trendline.
The average bullish trading volumes are higher than the average bearish trading volumes, hinting at more short-term volatility.
LLY corrected with the S&P 500 Index, a bearish confirmation.
My LLY Short Stock Trade
LLY Entry Level: Between $1,007.38 and $1,033.38
LLY Take Profit: Between $783.85 and $809.63
LLY Stop Loss: Between $1,106.94 and $1,133.95
Risk/Reward Ratio: 2.25
Ready to trade our analysis of Eli Lilly? Here is our list of the best stock brokers worth checking out.