
Short Trade Idea
Enter your short position between $133.05 (yesterday’s intra-day low) and $134.27 (the upper band of its horizontal resistance zone).
Market Index Analysis
Duke Energy (NYSE:DUK) is a member of the S&P 100 Index and the S&P 500 Index.
Both indices trade inside bearish price channels as downside catalysts accumulate.
The Bull Bear Power Indicator for the S&P 500 Index is bearish with a descending trendline.
Market Sentiment Analysis
Equity futures are suggesting a bearish open as markets remain uncertain about President Trump’s Iran war strategy, as he calls for assistance, while also stating that he will focus on Cuba next. Volatility should remain elevated, and oil prices are moving higher, with Brent above $100. The Fed is expected to keep interest rates on hold this week, but the Reserve Bank of Australia hiked interest rates amid inflationary pressures. Earnings from Tencent, DocuSign, and Oklo are also on deck today.
Duke Energy Fundamental Analysis
Duke Energy operates seven nuclear facilities, amid a diverse mix of other power plants. Its service territory covers 104,000 square miles and includes 250,200 miles of distribution lines, serving over 7 million customers. Its nuclear power generation remains concentrated in North and South Carolina, and DUK maintains 58,200 megawatts of base-load and peak generation.
So, why am I bearish on DUK despite its recent 17%+ rally?
I turned bearish on Duke Energy amid ongoing ratemaking disputes and regulatory challenges in Ohio, North Carolina, and Florida. After three 2024 hurricanes resulted in restoration costs of $789 million, I worry that storm-related costs, even after issuing warnings to customers in the Carolinas to prepare for severe weather, will add to infrastructure strain. I am equally bearish on high debt levels and on sluggish, below-industry-average dividend growth.
Metric | Value | Verdict |
P/E Ratio | 21.15 | Bearish |
P/B Ratio | 2.04 | Bearish |
PEG Ratio | 2.77 | Bearish |
Current Ratio | 0.55 | Bearish |
ROIC-WACC Ratio | Negative | Bearish |
Duke Energy Fundamental Analysis Snapshot
The price-to-earnings (P/E) ratio of 21.15 makes DUK fairly valued. By comparison, the P/E ratio for the S&P 500 is 26.59.
The average analyst price target for DUK is $138.12. It suggests good upside potential with acceptable downside risks.
Duke Energy Technical Analysis
Today’s DUK Signal
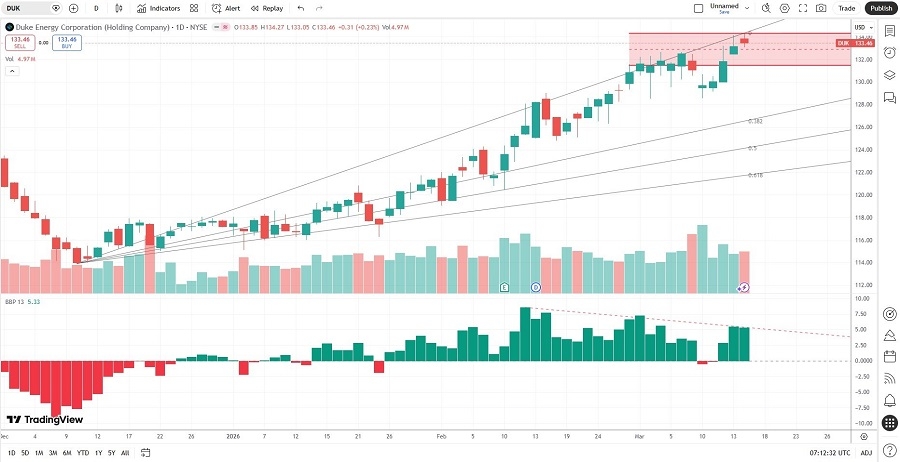
Duke Energy Price Chart
The DUK D1 chart shows price action inside a horizontal resistance zone.
It also shows price action between its ascending 0.0% and 38.2% Fibonacci Retracement Fan levels.
The Bull Bear Power Indicator is bullish with a negative divergence.
The average bullish trading volumes are higher than the average bearish trading volumes, suggesting more short-term volatility.
DUK moved higher as the S&P 500 Index declined, a bullish trading signal, but bearish catalysts are accumulating.
My DUK Short Stock Trade
DUK Entry Level: Between $133.05 and $134.27
DUK Take Profit: Between $113.90 and $116.25
DUK Stop Loss: Between $140.88 and $145.11
Risk/Reward Ratio: 2.45
Ready to trade our analysis of Duke Energy? Here is our list of the best stock brokers worth reviewing.