
Long Trade Idea
Enter your long position between $153.00 (the lower band of its horizontal support zone) and $158.91 (Friday’s intra-day high).
Market Index Analysis
DoorDash (NASDAQ:DASH) is a member of the NASDAQ 100 Index and the S&P 500 Index.
Both indices trade inside bearish chart patterns with dominant downside momentum.
The Bull Bear Power Indicator for the NASDAQ 100 Index is bearish and remains below its descending trendline.
Market Sentiment Analysis
Equity futures dropped after US President Trump issued a 48-hour ultimatum for Iran to reopen the Strait of Hormuz, or he would order the US military to obliterate Iran’s energy infrastructure. Iran responded that it would result in immediate retaliation against energy and oil infrastructure across the Gulf, and that it would also consider buyers of US Treasuries as legitimate targets. Tomorrow’s flash PMI will offer insight into how corporate America is coping with the fallout from the Iran war.
DoorDash Fundamental Analysis
DoorDash is the largest food delivery company in the US, with a 56% market share and a 60% share in convenience store deliveries. It caters to over 450,000 merchants, over 50,000,000 users across 40+ countries, and employs over 1,000,000 couriers.
So, why am I bullish on DASH despite its nearly 36% plunge?
DoorDash reported record revenues last quarter amid a 39% surge in Marketplace Gross Order Value (GOV) to $29.7 billion, and the successful integration of Deliveroo. I am bullish on its DoorDash Dot autonomous delivery robot unit, which it plans to scale this year. Its grocery and retail unit is set to turn earnings positive as basket sizes and logistics efficiency rise, and AI-native infrastructure should improve margins.
Metric | Value | Verdict |
P/E Ratio | 73.54 | Bearish |
P/B Ratio | 6.78 | Bearish |
PEG Ratio | 1.60 | Bullish |
Current Ratio | 1.41 | Bearish |
ROIC-WACC Ratio | Negative | Bearish |
DoorDash Fundamental Analysis Snapshot
The price-to-earning (P/E) ratio of 73.54 makes DASH an expensive stock. By comparison, the P/E ratio for the NASDAQ 100 Index is 34.99.
The average analyst price target for DASH is $258.00. It suggests excellent upside potential with reasonable downside risks.
DoorDash Technical Analysis
Today’s DASH Signal
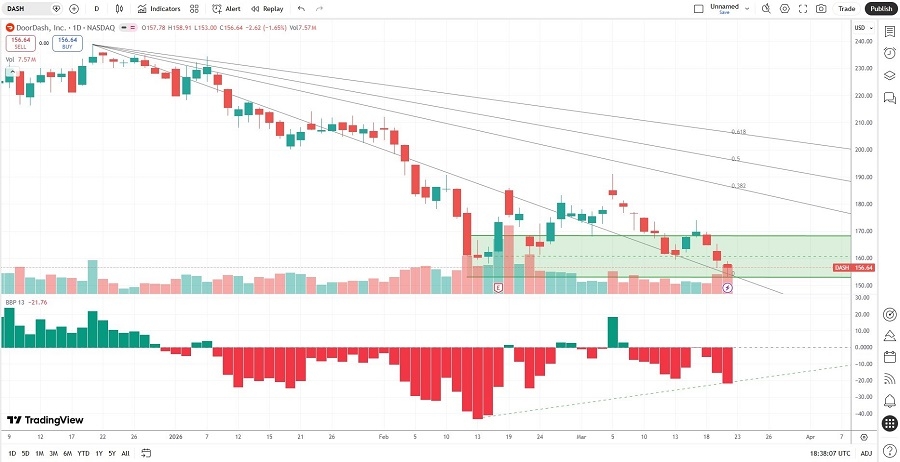
DoorDash Price Chart
The DASH D1 chart shows price action inside a horizontal support zone.
It also shows price action between its descending 0.0% and 38.2% Fibonacci Retracement Fan levels.
The Bull Bear Power Indicator is bearish with an ascending trendline.
The average bearish trading volumes are higher than the average bullish trading volumes, suggesting more short-term volatility
DASH corrected with the NASDAQ 100 Index, a bearish confirmation, but bullish catalysts are rising.
My DASH Long Stock Trade
DASH Entry Level: Between $153.00 and $158.91
DASH Take Profit: Between $200.20 and $205.58
DASH Stop Loss: Between $136.05 and $140.53
Risk/Reward Ratio: 2.79
Ready to trade our analysis of DoorDash? Here is our list of the best stock brokers worth reviewing.