
Long Trade Idea
Enter your long position between $114.62 (the lower band of its horizontal support zone) and $122.70 (the upper band of its horizontal support zone).
Market Index Analysis
Dollar General (NYSE:DG) is a member of the S&P 500 Index.
This index remains inside a bearish price channel with dominant downside pressures.
The Bull Bear Power Indicator for the S&P 500 Index is bearish with a descending trendline.
Market Sentiment Analysis
Equity futures suggest a bullish open amid optimism over de-escalation in the Iran war, following the US submitting a 15-point proposal via Pakistan to Iran to end the war. Volatility is likely to remain until more details emerge, especially in oil, which remains off its war peak, but at elevated levels, with Brent trading above and below $100 per barrel. On the economic front, today’s US import export data is on deck. In AI-related news, ARM’s new in-house chips increase competition across the semiconductor space.
Dollar General Fundamental Analysis
Dollar General is a discount retailer with over 19,000 stores and more than 170,000 employees. DG has a line of inexpensive private-label brands. It is also under heavy criticism for creating food deserts and low-wage jobs.
So, why am I bullish on DG despite the uncertainty surrounding its CEO transition?
Dollar General reported robust fourth-quarter earnings, beating the top and bottom lines, driven by a 4.3% increase in same-store sales, a 2.6% rise in customer traffic, and a 1.7% increase in average tickets. This resulted in a 122.9% year-over-year surge in net income and $1.93 in earnings per share. I remain bullish on its aggressive real estate plan, which includes 460+ new store openings and over 4,730 total real estate projects.
Metric | Value | Verdict |
P/E Ratio | 17.21 | Bullish |
P/B Ratio | 3.22 | Bearish |
PEG Ratio | 1.44 | Bullish |
Current Ratio | 1.13 | Bearish |
ROIC-WACC Ratio | Positive | Bullish |
Dollar General Fundamental Analysis Snapshot
The price-to-earnings (P/E) ratio of 17.21 makes DG an inexpensive stock. By comparison, the P/E ratio for the S&P 500 Index is 25.99.
The average analyst price target for DG is $148.57. This suggests there is excellent upside potential with fading downside risks.
Dollar General Technical Analysis
Today’s DG Signal
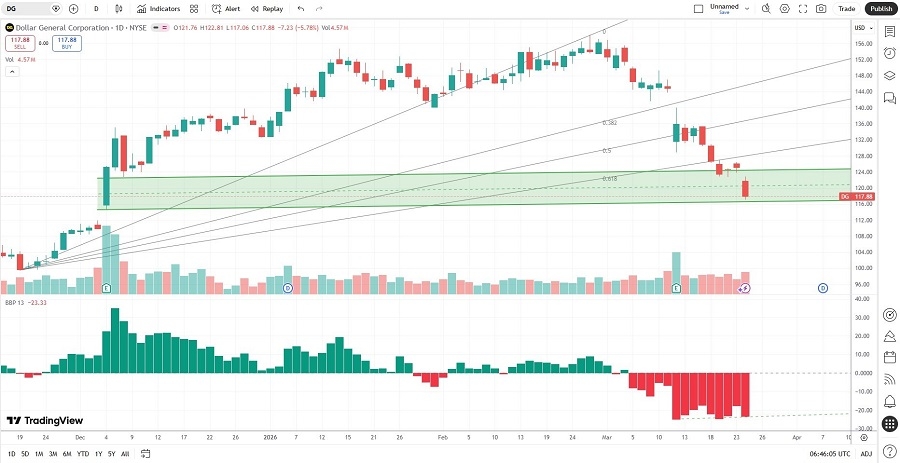
Dollar General Price Chart
The DG D1 chart shows price action inside a horizontal support zone.
It also shows price action below its ascending Fibonacci Retracement Fan.
The Bull Bear Power Indicator is bearish with a positive divergence.
The average bullish trading volumes are higher than the average bearish trading volumes.
DG corrected with the S&P 500 Index, a bearish confirmation, but bullish catalysts are accumulating.
My DG Long Stock Trade
DG Entry Level: Between $114.62 and $122.70
DG Take Profit: Between $149.23 and $158.23
DG Stop Loss: Between $99.50 and $104.52
Risk/Reward Ratio: 2.29
Ready to trade our analysis of Dollar General? Here is our list of the best stock brokers worth reviewing.