
Long Trade Idea
Enter your long position between $28.83 (the intra-day low of its last bearish candlestick) and $29.71 (yesterday’s intra-day high).
Market Index Analysis
Comcast (NASDAQ:CMCSA) is a member of the NASDAQ 100 Index, the S&P 100 Index, and the S&P 500 Index.
All three indices remain inside bearish price channels with dominant downside pressures.
The Bull Bear Power Indicator for the S&P 500 Index is bearish with a descending trendline.
Market Sentiment Analysis
Equity futures suggest a bullish open amid optimism over de-escalation in the Iran war, following the US submitting a 15-point proposal via Pakistan to Iran to end the war. Volatility is likely to remain until more details emerge, especially in oil, which remains off its war peak, but at elevated levels, with Brent trading above and below $100 per barrel. On the economic front, today’s US import export data is on deck. In AI-related news, ARM’s new in-house chips increase competition across the semiconductor space.
Comcast Fundamental Analysis
Comcast is a media and entertainment conglomerate. It is also the world’s fourth largest media company measured by revenue. In the US, it is the third-largest pay TV company, the second-largest cable TV company, and the largest internet service provider.
So, why am I bullish on CMCSA amid its recent pullback?
Peacock subscriber growth and the NBCUniversal product pipeline should deliver future growth. The former has over 44 million paid subscribers and focuses on domestic growth rather than international expansion, while the latter features highly anticipated revenue drivers like The Super Mario Galaxy Movie, Disclosure Day, and Minions 3. I am equally bullish on Comcast's operational streamlining, such as the Versant Media Group spin-off.
Metric | Value | Verdict |
P/E Ratio | 5.42 | Bullish |
P/B Ratio | 1.08 | Bullish |
PEG Ratio | 0.19 | Bullish |
Current Ratio | 0.88 | Bullish |
ROIC-WACC Ratio | Positive | Bullish |
Comcast Fundamental Analysis Snapshot
The price-to-earnings (P/E) ratio of 5.42 makes CMCSA an inexpensive stock. By comparison, the P/E ratio for the S&P 500 Index is 25.99.
The average analyst price target for CMCSA is $32.92. It suggests moderate upside potential with manageable downside risks.
Comcast Technical Analysis
Today’s CMCSA Signal
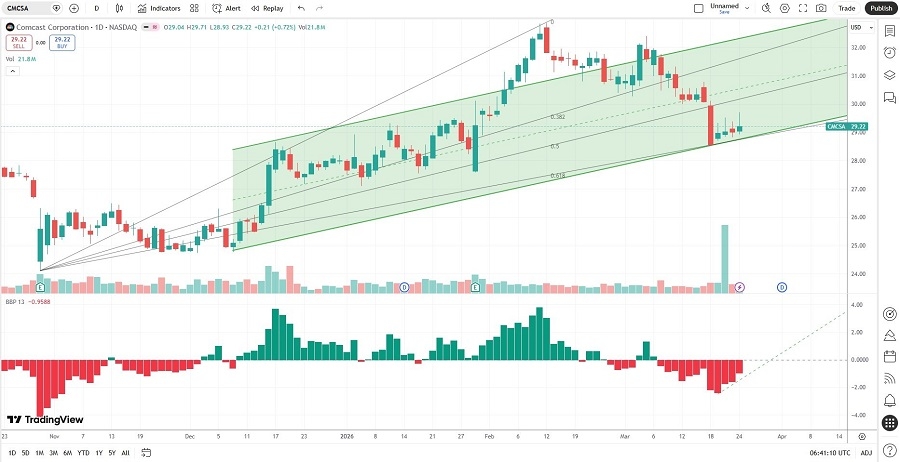
Comcast Price Chart
The CMCSA D1 chart shows price action inside a bullish price channel.
It also shows price action between its ascending 50.0% and 61.8% Fibonacci Retracement Fan levels.
The Bull Bear Power Indicator is bearish with an ascending trendline.
The average bullish trading volumes are higher than the average bearish trading volumes.
CMCSA has outperformed the S&P 500 Index over the past few trading sessions, a bullish confirmation.
My CMCSA Long Stock Trade
CMCSA Entry Level: Between $28.83 and $29.71
CMCSA Take Profit: Between $37.30 and $38.42
CMCSA Stop Loss: Between $24.78 and $25.46
Risk/Reward Ratio: 2.09
Ready to trade our analysis of Comcast? Here is our list of the best stock brokers worth reviewing.