
Short Trade Idea
Enter your short position between $201.14 (yesterday’s intra-day low) and $213.47 (the intra-day high of its last bullish candlestick).
Market Index Analysis
Coinbase (NASDAQ:COIN) is a member of the S&P 500 Index.
This index trades inside a bearish price channel with rising bearish trading volumes.
The Bull Bear Power Indicator for the S&P 500 Index is bearish and remains below its descending trendline.
Market Sentiment Analysis
Equity futures are drifting lower following yesterday’s slump that sent the Dow Jones Industrial Average to a fresh 2026 low after surging PPI inflation in February, before oil prices spiked over 50%+ due to the Iran war. Still, Fed Chair Powell dismissed stagflation concerns, calling it a term from the 1970s. Micron shares fell after the market closed despite a stellar earnings report, while Alibaba and FedEx will report earnings today.
Coinbase Fundamental Analysis
Coinbase is the world’s biggest Bitcoin custodian and the largest US-based cryptocurrency exchange with over 100 million users. It operates in over 100 countries, holds over $400 billion in assets, including over 12% of Bitcoins and over 11% of all staked Ether.
So, why am I bearish on COIN despite its current counter-market rally?
While its strategic partnership with Bybit enhances its global footprint, I remain bearish on Coinbase amid declining transaction revenues despite rising user numbers. Forecasts call for a 6% contraction in higher-margin retail trading, with average monthly revenue contracting to $59.20 in 2026. I am equally bearish on the $5 billion USDC supply drop to $75 billion, which decreases interest income from short-term bonds. The Coinbase support withdrawal from the Senate’s version of the CLARITY Act adds to regulatory uncertainty and heightened regulatory scrutiny.
Metric | Value | Verdict |
P/E Ratio | 45.46 | Bearish |
P/B Ratio | 3.75 | Bearish |
PEG Ratio | 0.78 | Bullish |
Current Ratio | 2.34 | Bullish |
ROIC-WACC Ratio | Negative | Bearish |
Coinbase Fundamental Analysis Snapshot
The price-to-earnings (P/E) ratio of 45.46 makes COIN an expensive stock. By comparison, the P/E ratio for the S&P 500 Index is 26.37.
The average analyst price target for COIN is $252.10. This suggests excellent upside potential, but downside risks remain elevated.
Coinbase Technical Analysis
Today’s COIN Signal
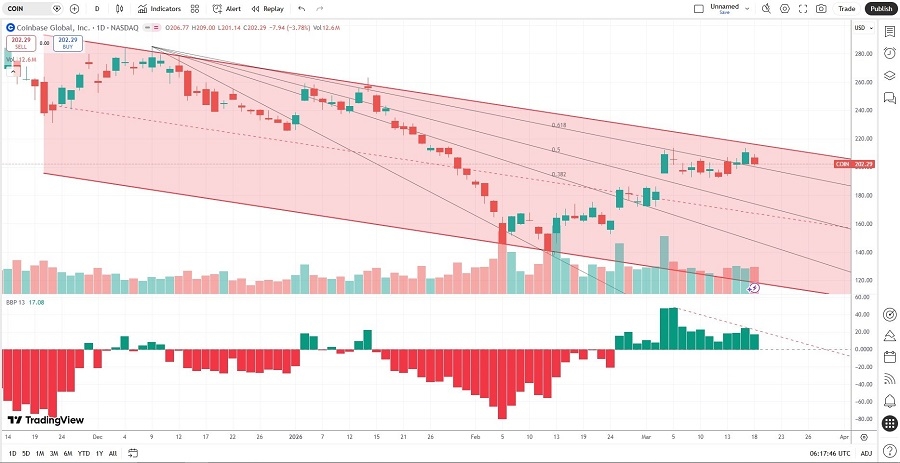
Coinbase Price Chart
The COIN D1 chart shows price action inside a bearish price channel.
It also shows price action just above its descending Fibonacci Retracement Fan.
The Bull Bear Power Indicator is bullish with a negative divergence.
The average bullish trading volumes are higher than the average bearish trading volumes, suggesting short-term volatility.
COIN advanced as the S&P 500 Index corrected, a bullish development, but breakdown catalysts remain.
My COIN Short Stock Trade
COIN Entry Level: Between $201.14 and $213.47
COIN Take Profit: Between $139.36 and $146.16
COIN Stop Loss: Between $231.17 and $238.49
Risk/Reward Ratio: 2.06
Ready to trade our analysis of Coinbase? Here is our list of the best stock brokers worth reviewing.