
Long Trade Idea
Enter your long position between $307.93 (the intra-day low of its last bearish candlestick) and $315.88 (yesterday’s intra-day high).
Market Index Analysis
Broadcom (AVGO) is a member of the NASDAQ 100 Index, the S&P 100 Index, and the S&P 500 Index.
All three indices trade within bearish chart patterns with rising downside catalysts.
The Bull Bear Power Indicator of the NASDAQ 100 Index is bearish with a descending trendline.
Market Sentiment Analysis
Equity markets sold off for a second day yesterday but closed the day notably off session lows as the Iran war concluded its fourth day. Yesterday’s rally was sparked after US President Trump announced the US would extend insurance to tankers passing through the Strait of Hormuz and provide military escorts to protect them against attacks. Equity futures are pointing to another sell-off this morning, as the war enters its fifth day. Today’s ADP report could inject volatility ahead of Friday’s NFP report. Earnings season is quieting down, but releases from Broadcom, Costco, and Alibaba will offer crucial insights into the AI trade and into consumer spending.
Broadcom Fundamental Analysis
Broadcom designs, develops, manufactures, and supplies semiconductor and infrastructure software products. It primarily serves the data center, networking, software, broadband, wireless, storage, and industrial markets.
So, why am I bullish on AVGO ahead of its earnings release?
I am bullish on Broadcom based on its underappreciated high-speed networking components (800G/1.6T) and custom AI silicon (XPUs). It currently has a $73 billion AI backlog, and I expect AVGO to beat on the top and bottom line with a healthy outlook. Projected AI-related revenue calls for a 116% growth rate in 2026 and 78% in 2027. I am also bullish about VMware’s integration and about the subscription-based VMware Cloud Foundation (VCF). The balanced business model offers diversification and decreases overall risk.
Metric | Value | Verdict |
P/E Ratio | 65.79 | Bearish |
P/B Ratio | 18.59 | Bearish |
PEG Ratio | 0.89 | Bullish |
Current Ratio | 1.71 | Bearish |
ROIC-WACC Ratio | Positive | Bullish |
Broadcom Fundamental Analysis Snapshot
The price-to-earnings (P/E) ratio of 65.79 makes AVGO an expensive stock. By comparison, the P/E ratio for the NASDAQ 100 Index is 33.93.
The average analyst price target for AVGO is $453.06. This suggests excellent upside potential with acceptable downside risks.
Broadcom Technical Analysis
Today’s AVGO Signal
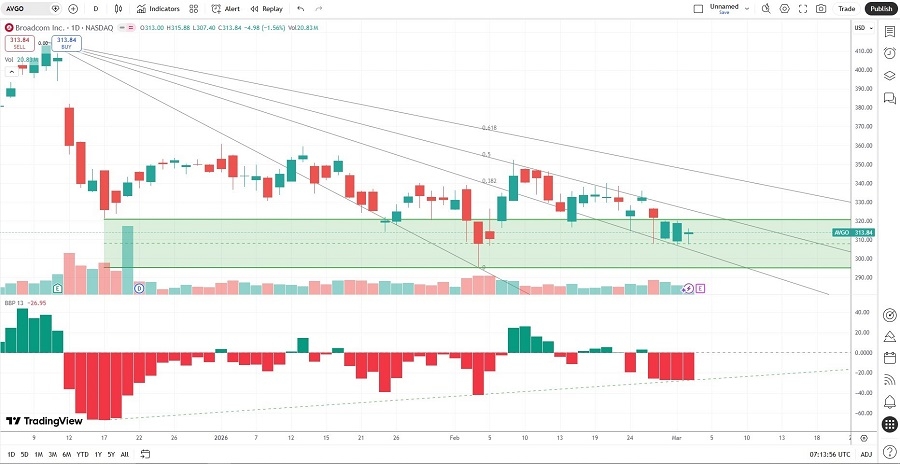
Broadcom Price Chart
The AVGO D1 chart shows price action inside a horizontal support zone.
It also shows price action between its descending 38.2% and 50.0% Fibonacci Retracement Fan levels.
The Bull Bear Power Indicator is bearish with an ascending trendline.
The average bullish trading volumes are higher than the average bearish trading volumes.
AVGO corrected less than the NASDAQ 100 Index over the past few weeks, a bullish confirmation.
My AVGO Long Stock Trade
AVGO Entry Level: Between $307.93 and $315.88
AVGO Take Profit: Between $394.19 and $409.30
AVGO Stop Loss: Between $265.43 and $277.71
Risk/Reward Ratio: 2.03
Ready to trade our analysis of Broadcom? Here is our list of the best stock brokers worth checking out.