
Short Trade Idea
Enter your short position between $488.26 (an intermediate horizontal support level) and $495.22 (an intermediate horizontal resistance level).
Market Index Analysis
- Berkshire Hathaway (BRK.B) is a member of the S&P 100 Index and the S&P 500 Index.
- Both indices are trading inside bearish price channels.
- The Bull Bear Power Indicator of the S&P 500 Index is bearish with a descending trendline.
Market Sentiment Analysis
Equity futures suggest a plunge at the open as markets reassess risk from this weekend’s military action by the US and Israel on Iran. Oil prices spiked during the Asian session amid concerns about the Strait of Hormuz, eclipsing $82 for international Brent Crude before retreating moderately. Iran’s retaliatory strikes may intensify in the coming days. On the economic front, US inflation jumped in January, and all eyes are on Friday’s NFP report. Earnings from Broadcom, Marvell Technology, Target, and Costco will offer more details about the AI trade and the health of consumer spending.
Berkshire Hathaway Fundamental Analysis
Berkshire Hathaway is a multinational conglomerate holding company that many compare to an investment fund. In the ten years ending in 2023, Berkshire Hathaway produced a compound annual growth rate of 11.8% versus 12.0% for the S&P 500 Index.
So, why am I bearish on BRK.B following its earnings release?
While I am cautiously optimistic about the leadership change away from Buffett to Abel, its growing cash position and reliance on US Treasuries raise red flags. Operating earnings plunged by over 30% in the latest quarter, and portfolio missteps continue to accumulate. Berkshire Hathaway remains absent from high-growth sectors, and its $3.76 billion write-down of Kraft Heinz raised questions. The absence of share buybacks despite favorable conditions adds to short-term uncertainty.
BRK.Bric | Value | Verdict |
P/E Ratio | 16.15 | Bullish |
P/B Ratio | 1.56 | Bullish |
PEG Ratio | Unavailable | Bearish |
Current Ratio | 2.72 | Bullish |
ROIC-WACC Ratio | Negative | Bearish |
Berkshire Hathaway Fundamental Analysis Snapshot
The price-to-earning (P/E) ratio of 16.15 makes BRK.B an inexpensive stock. By comparison, the P/E ratio for the S&P 500 Index is 29.55.
The average analyst price target for BRK.B is $526.00. This suggests moderate upside potential, while downside pressures are rising.
Berkshire Hathaway Technical Analysis
Today’s BRK.B Signal
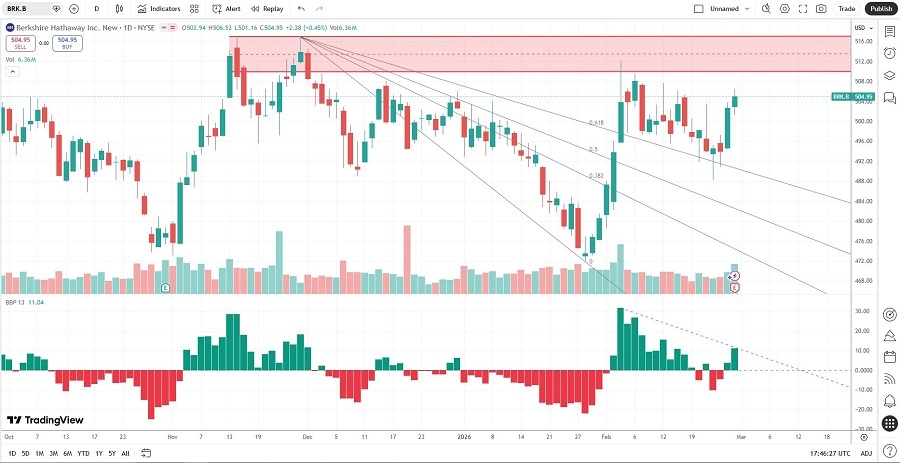
Berkshire Hathaway B Shares Price Chart
- The BRK.B D1 chart shows price action below its horizontal resistance zone.
- It also shows price action above its descending Fibonacci Retracement Fan.
- The Bull Bear Power Indicator is bullish with a descending trendline.
- The average bearish trading volumes are higher than the average bullish trading volumes.
- BRK.B corrected with the S&P 500 Index, a bearish confirmation.
My BRK.B Short Stock Trade
- BRK.B Entry Level: Between $488.26 and $495.22
- BRK.B Take Profit: Between $437.90 and $443.92
- BRK.B Stop Loss: Between $506.52 and $512.13
- Risk/Reward Ratio: 2.76
Ready to trade our analysis of Berkshire Hathaway? Here is our list of the best stock brokers worth checking out.