
Short Trade Idea
Enter your short position between $246.00 (Friday’s intra-day low) and $249.20 (Friday’s intra-day high).
Market Index Analysis
- Apple (NASDAQ:AAPL) is a member of the NASDAQ 100 Index, the Dow Jones Industrial Average Index, the S&P 100 Index, and the S&P 500 Index.
- All four indices trade inside bearish chart patterns with dominant downside momentum.
- The Bull Bear Power Indicator for the NASDAQ 100 Index is bearish and remains below its descending trendline.
Market Sentiment Analysis
Equity futures dropped after US President Trump issued a 48-hour ultimatum for Iran to reopen the Strait of Hormuz, or he would order the US military to obliterate Iran’s energy infrastructure. Iran responded that it would result in immediate retaliation against energy and oil infrastructure across the Gulf, and that it would also consider buyers of US Treasuries as legitimate targets. Tomorrow’s flash PMI will offer insight into how corporate America is coping with the fallout from the Iran war.
Apple Fundamental Analysis
Apple is the largest tech company by revenue and the third-largest company by market capitalization. It is at the core of the US tech industry, but it is missing out on several disruptive trends. Still, it has high brand loyalty and a massive following.
So, why am I bearish on AAPL amid its current 12%+ correction?
Regulatory pressure on Apple’s App Store could force a 30% reduction in commissions, while Apple also faces a potential $38 billion fine in India and a €500 million EU penalty for anti-competitive behavior. Despite a stellar iPhone 17 launch in China, margin pressure amid intensifying pressures continues to rise. The delayed launch of AI-powered Siri, in partnership with Google’s Gemini, adds to execution risks, magnified by insider selling.
Metric | Value | Verdict |
P/E Ratio | 31.35 | Bearish |
P/B Ratio | 41.28 | Bearish |
PEG Ratio | 2.20 | Bearish |
Current Ratio | 0.97 | Bearish |
ROIC-WACC Ratio | Positive | Bullish |
Apple Fundamental Analysis Snapshot
The price-to-earnings (P/E) ratio of 31.35 indicates that AAPL is fairly valued. By comparison, the P/E ratio for the NASDAQ 100 Index is 34.99.
The average analyst price target for AAPL is $295.44. This suggests that there is some excellent upside potential, but downside risks are greater.
Apple Technical Analysis
Today’s AAPL Signal
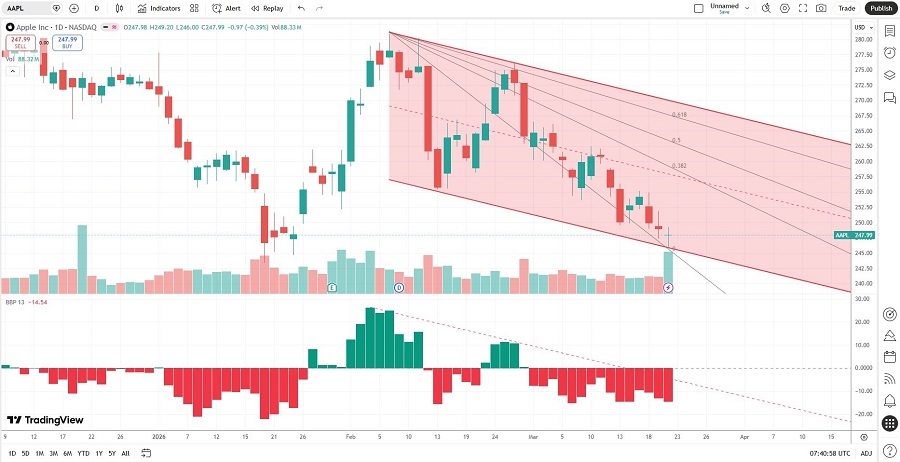
Apple Price Chart
- The AAPL D1 chart shows price action inside a bearish price channel.
- It also shows price action between its descending 0.0% and 38.2% Fibonacci Retracement Fan levels.
- The Bull Bear Power Indicator is bearish with a descending trendline.
- The average bearish trading volumes are higher than the average bullish trading volumes.
- AAPL corrected with the NASDAQ 100 Index, a bearish confirmation.
My AAPL Short Stock Trade
- AAPL Entry Level: Between $246.00 and $249.20
- AAPL Take Profit: Between $211.27 and $216.58
- AAPL Stop Loss: Between $262.13 and $266.15
- Risk/Reward Ratio: 2.15
Ready to trade our analysis of Apple? Here is our list of the best stock brokers worth reviewing.