
Short Trade Idea
Enter your short position between $359.80 (yesterday’s intra-day low) and $364.72 (an intermediate horizontal resistance level).
Market Index Analysis
Amgen (NASDAQ:AMGN) is a member of the NASDAQ 100 Index, the Dow Jones Industrial Average Index, the S&P 100 Index, and the S&P 500 Index.
All four indices trade inside bearish price channels with decreasing bullish trading volumes.
The Bull Bear Power Indicator for the NASDAQ 100 Index turned bullish but remains below its descending trendline.
Market Sentiment Analysis
Equity futures point higher as markets await today’s Fed interest rate decision. While no change is expected, any comments regarding future monetary policy, especially after surging oil prices due to the Iran war, are likely to move markets. China granted NVIDIA approval to sell its second-most powerful AI chip, H200. On the earnings front, Micron Technology, General Mills, and Macy’s are on deck today.
Amgen Fundamental Analysis
Amgen is the 18th largest biomedical company by revenue, a Fortune 500 company, and has 17 clinical programs in Phase III, 8 in Phase II, and 19 in Phase I.
So, why am I bearish on AMGN following its breakdown?
I turned bearish on Amgen amid patent cliffs for Enbrel, Prolia, Xgeva, and Otezla that could wipe out between $8 and $ 10 billion in revenue over the next few years, while its current pipeline appears unable to offset these losses. Revenue erosion from its Biosimilars Prolia and Xgeva adds to revenue concerns, with CVS Health switching to lower-cost biosimilars in April 2026. Delays to its obesity drug MariTide and Merck‘s competition for Repatha add to my bearish outlook.
Metric | Value | Verdict |
P/E Ratio | 25.38 | Bullish |
P/B Ratio | 22.80 | Bearish |
PEG Ratio | 2.45 | Bearish |
Current Ratio | 1.14 | Bearish |
ROIC-WACC Ratio | Positive | Bullish |
Amgen Fundamental Analysis Snapshot
The price-to-earning (P/E) ratio of 25.38 makes AMGN an inexpensive stock. By comparison, the P/E ratio for the NASDAQ 100 Index is 36.27.
The average analyst price target for AMGN is $350.03. This suggests no upside potential with rising downside risks.
Amgen Technical Analysis
Today’s AMGN Signal
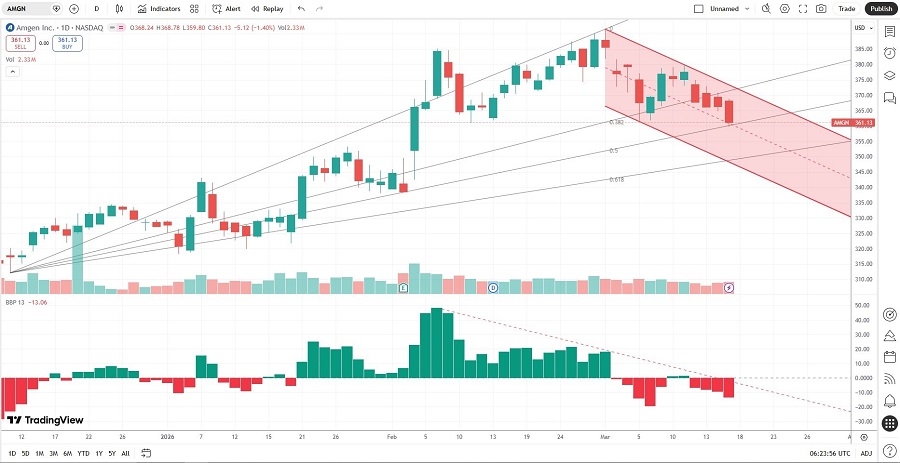
Amgen Price Chart
The AMGN D1 chart shows price action inside a bearish price channel.
It also shows price action between its ascending 38.2% and 50.0% Fibonacci Retracement Fan levels.
The Bull Bear Power Indicator turned bearish with a descending trendline.
The average bearish trading volumes are higher than the average bullish trading volumes.
AMGN corrected with the NASDAQ 100 Index, which is a bearish trading signal.
My AMGN Short Stock Trade
AMGN Entry Level: Between $359.80 and $364.72
AMGN Take Profit: Between $303.82 and $312.39
AMGN Stop Loss: Between $381.89 and $391.29
Risk/Reward Ratio: 2.53
Ready to trade our analysis of Amgen? Here is our list of the best stock brokers worth reviewing.