
Short Trade Idea
Enter your short position between $84.57 (the lower band of its horizontal support zone) and $87.35 (the upper band of its horizontal support zone).
Market Index Analysis
- Sysco Corporation (SYY) is a member of the S&P 500 Index.
- This index trades near all-time highs but decreasing trading volumes do not support the uptrend.
- The Bull Bear Power Indicator of the S&P 500 turned bullish but remains below its descending trendline.
Market Sentiment Analysis
Equity futures are drifting lower after the Dow Jones Industrial Average recorded another record high, and the S&P 500 is approaching its own record. Retail sales data could inject volatility today, but tomorrow’s January NFP report remains the core economic driver this week. Earnings from Coca-Cola and volatility in gold, silver, and Bitcoin are other factors to monitor today. Despite the two-day rebound, tech companies face downside pressure from surging memory costs, which threaten profits and margins, while Alphabet plans the first 100-year bond since the dot-com era.
Sysco Corporation Fundamental Analysis
Sysco Corporation is the world’s largest food distributor. It has over 700,000 customers and operates 340 distribution centers in ten countries.
So, why am I bearish on SYY despite its 22%+ rally?
The $52 million whistleblower verdict might be a small distraction, but ongoing margin compression reinforces my bearish stance. Its recent earnings report left me unimpressed, and insider selling picked up over the past few weeks. Its share price trades near the average analyst price target, and I see no near-term catalysts, while I am concerned about its excessive debt levels and negative free cash flow under a low-margin distribution model. SYY is also nearing market saturation, leaving little room for organic growth.
MSYYic | Value | Verdict |
P/E Ratio | 23.31 | Bullish |
P/B Ratio | 18.14 | Bearish |
PEG Ratio | 1.32 | Bullish |
Current Ratio | 1.29 | Bearish |
ROIC-WACC Ratio | Positive | Bullish |
The price-to-earnings (P/E) ratio of 23.31 makes SYY an inexpensive stock. By comparison, the P/E ratio for the S&P 500 is 29.90.
The average analyst price target for SYY is $89.94, suggesting negligible upside potential with expanding downside risks.
Sysco Corporation Technical Analysis h2
Today’s SYY Signal
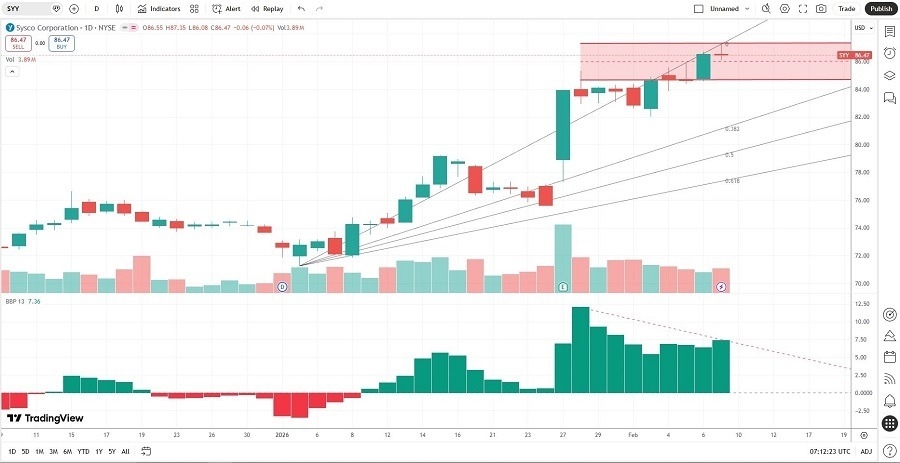
- The SYY D1 chart shows price action forming a new horizontal resistance zone.
- It also shows price action between its 0.0% and 38.2% ascending, Fibonacci Retracement Fan levels.
- The Bull Bear Power Indicator is bullish with a negative divergence.
- The average bearish trading volumes are higher than the average bullish trading volumes.
- SYY advanced with the S&P 500, a bullish confirmation, but bearish indicators are rising.
My SYY Short Stock Trade
- SYY Entry Level: Between $84.57 and $87.35
- SYY Take Profit: Between $71.23 and $73.67
- SYY Stop Loss: Between $89.94 and $91.74
- Risk/Reward Ratio: 2.48
Ready to trade our analysis of Sysco Corporation? Here is our list of the best stock brokers worth reviewing.