

Long Trade Idea
Enter your long position between $174.57 (the lower band of its horizontal resistance zone) and $187.28 (the upper band of its horizontal resistance zone).
Market Index Analysis
Salesforce (CRM) is a member of the Dow Jones Industrial Average, the S&P 100 Index, and the S&P 500 Index.
All three indices trade within bearish chart patterns and rising bearish trading volumes.
The Bull Bear Power Indicator for the S&P 500 is bearish with a descending trendline.
Market Sentiment Analysis
Equity futures are hovering near their baseline as markets await NVIDIA’s earnings report after the bell today. The TACO trade was back on yesterday, after global tariffs began at 10% rather than the 15% alternative President Trump suggested. The State of the Union address focused on more tariffs, as President Trump experienced the first political pushback over his economic policy. Traders also monitor geopolitical tensions, the Bitcoin sell-off remains in focus, and questions over the relief rally in software and cybersecurity stocks remain. Besides NVIDIA earnings, Salesforce and Snowflake will report after the bell.
Salesforce Fundamental Analysis
Salesforce is a cloud-based software company focused on sales, customer service, marketing automation, e-commerce, analytics, artificial intelligence, and application development. CRM is one of the 100 largest companies by market capitalization globally, and the world’s largest enterprise applications firm.
So, why am I bullish on CRM ahead of its earnings release?
I am bullish as I expect a robust outlook driven by its Agentforce AI platform, while the recent sell-off lowered valuations to attractive levels. Fears about Anthropic’s latest AI agents are overblown, and I see them as complementary to CRM products. Agentforce exceeded $500 million in ARR, 9,500+ paid deals, and over 3.2 trillion processed tokens just 18 months after its launch. Salesforce remains uniquely positioned to capitalize on the AI-driven systems-of-action trend, bolstered by its acquisition of Informatica.
P/E Ratio | 24.76 | Bullish |
Salesforce Fundamental Analysis Snapshot
The price-to-earnings (P/E) ratio of 24.76 makes CRM an inexpensive stock. By comparison, the P/E ratio for the S&P 500 Index is 29.61.
The average analyst price target for CRM is $306.29. This suggests an excellent upside potential with decreasing downside risks.
Salesforce Technical Analysis
Today’s CRM Signal
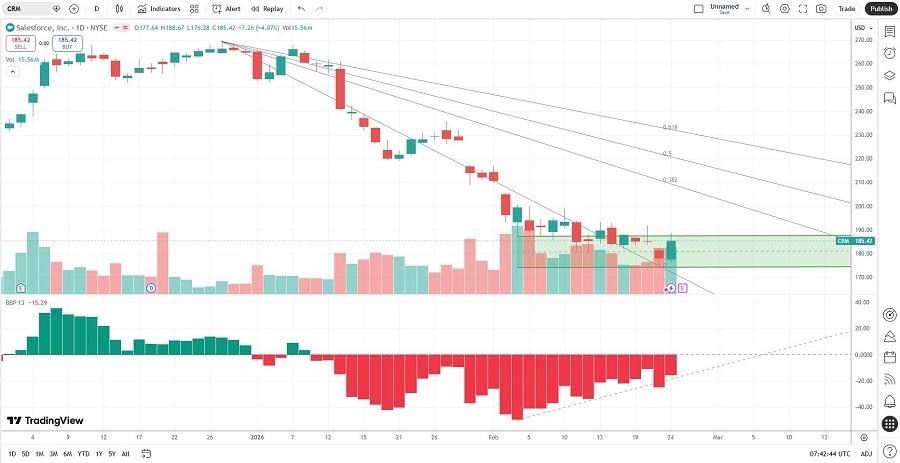
Salesforce Price Chart
The CRM D1 chart shows price action inside a horizontal support zone.
It also shows price action between its descending 0.0% and 38.2% Fibonacci Retracement Fan levels.
The Bull Bear Power Indicator is bearish with a positive divergence.
The average bullish trading volumes are rising.
CRM underperformed the S&P 500 Index, a bearish signal, but breakout catalysts are accumulating.
My CRM Long Stock Trade
CRM Entry Level: Between $174.57 and $187.28
CRM Take Profit: Between $235.74 and $248.43
CRM Stop Loss: Between $155.86 and $162.35
Risk/Reward Ratio: 3.27
Ready to trade our analysis of Salesforce? Here is our list of the best stock brokers worth checking out.