

Short Trade Idea
Enter your short position between $143.30 (yesterday’s intra-day) and $147.15 (the intra-day low of its last bearish candlestick).
Market Index Analysis
Palo Alto Networks (NASDAQ:PANW) is a member of the NASDAQ 100 Index and the S&P 500 Index.
Both indices are breaking down with mounting bearish catalysts.
The Bull Bear Power Indicator of the NASDAQ 100 Index is bearish with a descending trendline.
Market Sentiment Analysis
Equity futures are rising, attempting to recover from yesterday’s sell-off, amid renewed threats that AI will disrupt existing business models across corporate boardrooms. New tariff uncertainty following the Supreme Court’s ruling against President Trump’s tariffs, and the newly enacted global 15 tariff, sowed anger and confusion. IBM sales plunged amid a new Anthropic AI coding tool. Anthropic will reveal its latest advancements at an event today, markets will receive the latest consumer confidence data, and earnings from NVIDIA, Home Depot, Salesforce, and Snowflake are on deck.
Palo Alto Networks Fundamental Analysis
Palo Alto Networks is a cybersecurity company that offers advanced firewalls and cloud-based products, serving over 70,000 organizations across 150 countries, including 85 of the Fortune 100. It also houses the Unit 42 threat research team.
So, why am I bearish on PANW following its earnings release?
PANW beat revenue and earnings per share estimates of $2.58 billion and $0.94, respectively, by reporting $2.59 billion and $1.03, but despite its 35%+ correction, valuations remain sky-high and disconnected from economic reality. I remain bearish on its negative free cash flow yield, decelerating growth rates for its next-generation products, and slowing subscription and support growth. The enterprise-focused sales model is another red flag, as it struggles to adapt to developer-centric security trends, resulting in competitive and strategic risks.
Metric | Value | Verdict |
P/E Ratio | 90.65 | Bearish |
P/B Ratio | 18.11 | Bearish |
PEG Ratio | 1.87 | Bullish |
Current Ratio | 1.04 | Bearish |
ROIC-WACC Ratio | Negative | Bearish |
Palo Alto Networks Fundamental Analysis Snapshot
The price-to-earning (P/E) ratio of 90.65 makes PANW an expensive stock. By comparison, the P/E ratio for the NASDAQ 100 Index is 33.96.
The average analyst price target for PANW is $209.61. This suggests an excellent upside potential, but downside risks are greater.
Palo Alto Networks Technical Analysis
Today’s PANW Signal
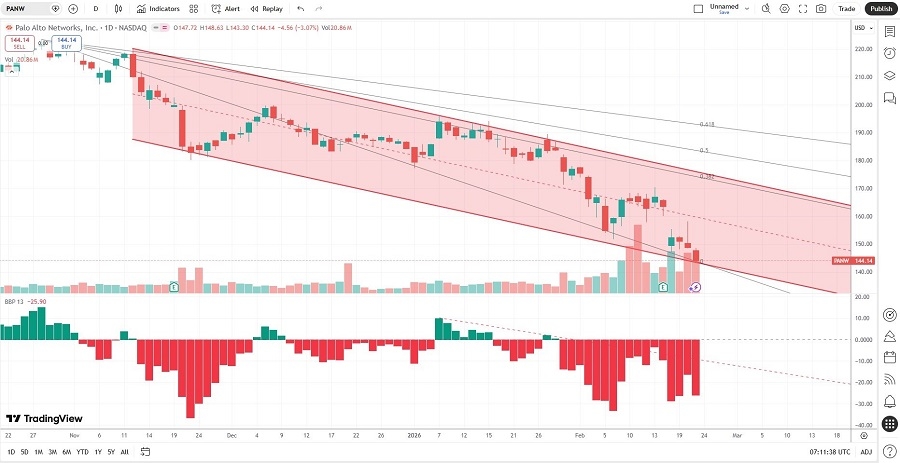
Palo Alto Networks Price Chart
The PANW D1 chart shows price action inside a bearish price channel.
It also shows price action between its descending 0.0% and 38.2% Fibonacci Retracement Fan levels.
The Bull Bear Power Indicator is bearish with a descending trendline.
The average bearish trading volumes are higher than the average bullish trading volumes.
PANW corrected more than the NASDAQ 100 Index did, which is a bearish confirmation.
My PANW Short Stock Trade
PANW Entry Level: Between $143.30 and $147.15
PANW Take Profit: Between $100.59 and $106.68
PANW Stop Loss: Between $163.50 and $170.49
Risk/Reward Ratio: 2.11
Ready to trade our analysis of Palo Alto Networks? Here is our list of the best stock brokers worth checking out.