

Short Trade Idea
Enter your short position between $262.56 (yesterday’s intra-day low) and $267.77 (an intermediate horizontal resistance level).
Market Index Analysis
Lowe’s (LOW) is a member of the S&P 100 Index and the S&P 500 Index.
Both indices trade inside bearish chart patterns as bullish trading volumes are contracting.
The Bull Bear Power Indicator of the S&P 500 Index turned bullish with a descending trendline.
Market Sentiment Analysis
Equity futures are sliding this morning, and NVIDIA’s earnings and upbeat outlook did little to calm valuation and capital expenditure fears. They failed to ignite the next leg higher of the AI trade, and signs of a temporary top are emerging. Salesforce tumbled, which offered a better indicator of market direction. Traders receive initial jobless claims today, followed by January’s PPI report tomorrow. On the earnings front, Warner Bros. Discovery, Dell Technologies, and CoreWeave are in focus today. Volatility is likely to remain over the next few trading weeks.
Lowe’s Fundamental Analysis
Lowe’s is a home improvement retailer with over 1,750 stores across the US. It is the second largest hardware store globally, trailing its rival Home Depot.
So, why am I bearish on LOW following its earnings report?
Lowe’s reported revenues of $20.58 billion and earnings per share of $1.98, besting estimates calling for revenues of $20.34 billion and $1.94, respectively. Still, I am bearish, as it issued sales guidance for 2026 of 0% to 2%. Its negative price-to-book value raises significant financial concerns, magnified by ongoing supply chain issues, rising labor costs, and economic headwinds, especially in the housing sector. Insider selling adds to red flags.
Metric | Value | Verdict |
P/E Ratio | 21.79 | Bearish |
P/B Ratio | Unavailable | Bearish |
PEG Ratio | 2.18 | Bullish |
Current Ratio | 1.04 | Bearish |
ROIC-WACC Ratio | Positive | Bullish |
Lowe’s Fundamental Analysis Snapshot
The price-to-earning (P/E) ratio of 21.79 makes LOW an expensive stock for a retailer. By comparison, the P/E ratio for the S&P 500 Index is 29.86.
The average analyst price target for LOW is $285.93. It suggests moderate upside potential, but downside risks are greater.
Lowe’s Technical Analysis
Today’s LOW Signal
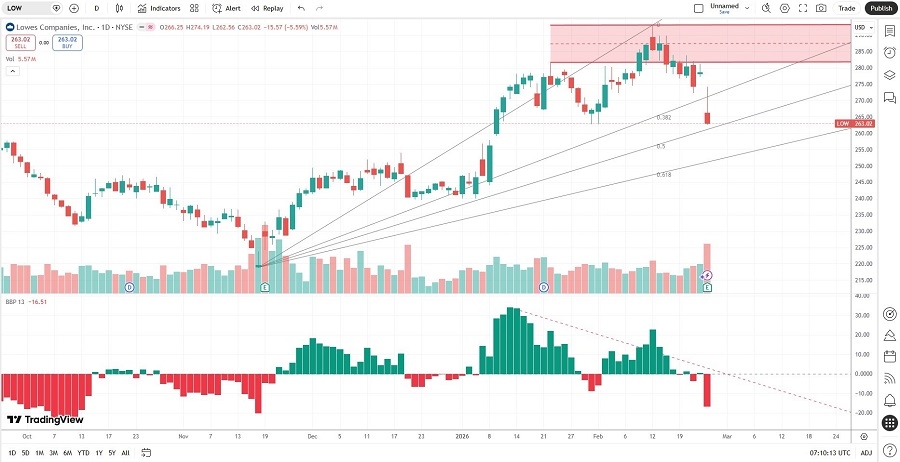
Lowe’s Companies Price Chart
The LOW D1 chart shows price action breaking down below a horizontal resistance zone.
It also shows price action between its ascending 38.2% and 50.0% Fibonacci Retracement Fan levels.
The Bull Bear Power Indicator turned bearish with a descending trendline.
The average bearish trading volumes are higher than the average bullish trading volumes.
LOW corrected as the S&P 500 advanced, a significant bearish trading signal.
My LOW Short Stock Trade
LOW Entry Level: Between $262.56 and $267.77
LOW Take Profit: Between $218.80 and $225.78
LOW Stop Loss: Between $283.81 and $293.06
Risk/Reward Ratio: 2.06
Ready to trade our analysis of Lowe’s Companies? Here is our list of the best stock brokers worth reviewing.