

Long Trade Idea
Enter your long position between $372.84 (the intra-day high of its last bearish candlestick) and $389.32 (an intermediate horizontal resistance level).
Market Index Analysis
Intuit (INTU) is a member of the NASDAQ 100 Index, the S&P 100 Index, and the S&P 500 Index.
All three indices trade inside bearish chart patterns as bullish trading volumes are contracting.
The Bull Bear Power Indicator of the NASDAQ 100 Index turned bullish with a descending trendline.
Market Sentiment Analysis
Equity futures are sliding this morning, and NVIDIA’s earnings and upbeat outlook did little to calm valuation and capital expenditure fears. They failed to ignite the next leg higher of the AI trade, and signs of a temporary top are emerging. Salesforce tumbled, which offered a better indicator of market direction. Traders receive initial jobless claims today, followed by January’s PPI report tomorrow. On the earnings front, Warner Bros. Discovery, Dell Technologies, and CoreWeave are in focus today. Volatility is likely to remain over the next few trading weeks.
Intuit Fundamental Analysis
Intuit is a business software company best known for its small business accounting software, QuickBooks. Other leading services include TurboTax, its e-mail marketing platform Mailchimp, and its credit monitoring service Credit Karma.
So, why am I bullish on INTU ahead of its earnings release?
I am bullish on its multi-year collaboration with Anthropic and the integration of advanced AI capabilities into QuickBooks, TurboTax, and Credit Karma. It also enables clients to develop custom AI agents using Claude’s SDK on Intuit’s platform. I am equally bullish about its in-house developed AI-native Intuit Enterprise Suite, which includes a Construction Edition targeting the $2 trillion construction industry. The recent sell-off lowered valuations to attractive levels, and I expect Intuit to deliver a bullish 2026 outlook with an earnings beat.
Metric | Value | Verdict |
P/E Ratio | 26.18 | Bullish |
P/B Ratio | 9.65 | Bearish |
PEG Ratio | 1.92 | Bullish |
Current Ratio | 1.39 | Bearish |
ROIC-WACC Ratio | Positive | Bullish |
Intuit Fundamental Analysis Snapshot
The price-to-earnings (P/E) ratio of 26.18 makes INTU an inexpensive stock. By comparison, the P/E ratio for the NASDAQ 100 Index is 34.39.
The average analyst price target for INTU is $729.26. This suggests an excellent upside potential with fading downside risks.
Intuit Technical Analysis
Today’s INTU Signal
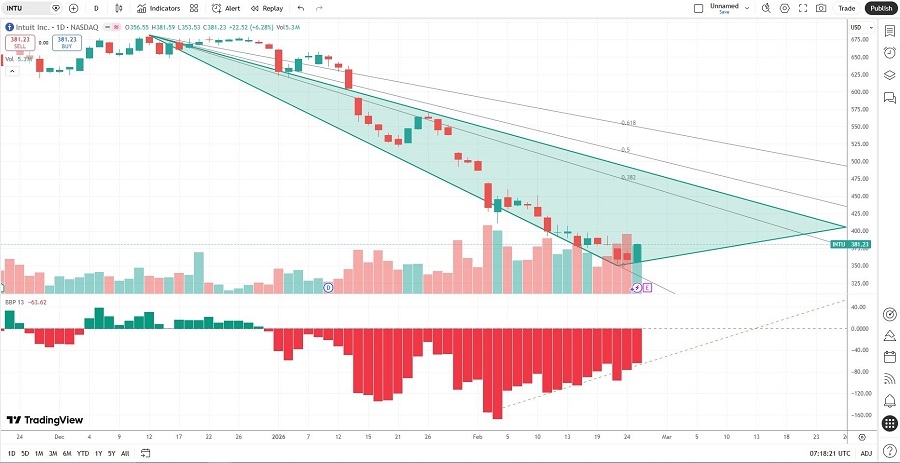
Intuit Price Chart
The INTU D1 chart shows price action inside a triangle pattern.
It also shows price action between its descending 0.0% and 38.2% Fibonacci Retracement Fan levels.
The Bull Bear Power Indicator is bearish with a positive divergence.
The average bearish trading volumes are higher than average bullish trading volumes, a trend to monitor.
INTU corrected more than the NASDAQ 100 Index, a bearish confirmation, but breakout catalysts are accumulating.
My INTU Long Stock Trade
INTU Entry Level: Between $372.84 and $389.32
INTU Take Profit: Between $451.09 and $469.99
INTU Stop Loss: Between $353.53 and $364.14
Risk/Reward Ratio: 4.05
Ready to trade our analysis of Intuit? Here is our list of the best stock brokers worth reviewing.