

Short Trade Idea
Enter your short position between $382.21 (yesterday’s intra-day low) and $394.35 (yesterday’s intra-day high).
Market Index Analysis
Home Depot (HD) is a member of the Dow Jones Industrial Average, the S&P 100 Index, and the S&P 500 Index.
All three indices trade within bearish chart patterns and rising bearish trading volumes.
The Bull Bear Power Indicator for the S&P 500 Index is bearish with a descending trendline.
Market Sentiment Analysis
Equity futures are hovering near their baseline as markets await NVIDIA’s earnings report after the bell today. The TACO trade was back on yesterday, after global tariffs began at 10% rather than the 15% alternative President Trump suggested. The State of the Union address focused on more tariffs, as President Trump experienced the first political pushback over his economic policy. Traders also monitor geopolitical tensions, the Bitcoin sell-off remains in focus, and questions over the relief rally in software and cybersecurity stocks remain. Besides NVIDIA earnings, Salesforce and Snowflake will report after the bell.
Home Depot Fundamental Analysis
Home Depot is the largest home improvement retailer in the US. It operates 90 distribution centers throughout the US, serving over 2,000 Home Depot stores. Home Depot also owns several private brands and subsidiaries. It is also the seventh largest US–based employer globally.
So, why am I bearish on HD following its earnings report?
Home Depot beat revenue and earnings per share expectations of $38.1 billion and $2.53, by reporting $38.2 billion and $2.72, respectively, but it issued cautious guidance. It cited high interest rates and economic uncertainty as core factors for its outlook. The lack of storm activity limited near-term growth drivers, and HD faces declining same-store sales, partly due to persistent housing market concerns. So, I am bearish on Home Depot at current levels and valuations.
Metric | Value | Verdict |
P/E Ratio | 27.02 | Bearish |
P/B Ratio | 36.87 | Bearish |
PEG Ratio | 3.90 | Bearish |
Current Ratio | 1.05 | Bearish |
ROIC-WACC Ratio | Positive | Bullish |
Home Depot Fundamental Analysis Snapshot
The price-to-earning (P/E) ratio of 27.02 makes HD an expensive stock in its industry. By comparison, the P/E ratio for the S&P 500 Index is 29.61.
The average analyst price target for HD is $405.24. This suggests negligible upside potential while downside risks are rising.
Home Depot Technical Analysis
Today’s HD Signal
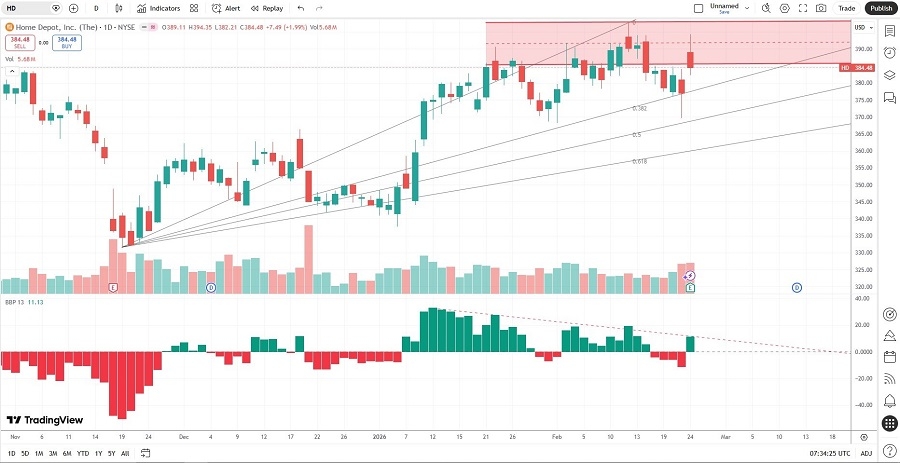
Home Depot Price Chart
The HD D1 chart shows price action breaking down below its horizontal resistance zone.
It also shows price action between its ascending 0.0% and 38.2% Fibonacci Retracement Fan levels.
The Bull Bear Power Indicator turned bullish but remains below its descending trendline.
The average bearish trading volumes are higher than the average bullish trading volumes.
HD outperformed the S&P 500 Index, a bullish signal, but bearish catalysts dominate.
My HD Short Stock Trade
HD Entry Level: Between $382.21 and $394.35
HD Take Profit: Between $331.37 and $344.10
HD Stop Loss: Between $405.24 and $417.40
Risk/Reward Ratio: 2.21
Ready to trade our analysis of Home Depot? Here is our list of the best stock brokers worth checking out.