

Short Trade Idea
Enter your short position between $148.13 (yesterday’s intra-day low) and $151.27 (yesterday’s intra-day high).
Market Index Analysis
Exxon Mobil (XOM) is a member of the S&P 100 Index and the S&P 500 Index.
Both indices are breaking down with mounting bearish catalysts.
The Bull Bear Power Indicator of the S&P 500 Index is bearish with a descending trendline.
Market Sentiment Analysis
Equity futures are rising, attempting to recover from yesterday’s sell-off, amid renewed threats that AI will disrupt existing business models across corporate boardrooms. New tariff uncertainty following the Supreme Court’s ruling against President Trump’s tariffs, and the newly enacted global 15 tariff, sowed anger and confusion. IBM sales plunged amid a new Anthropic AI coding tool. Anthropic will reveal its latest advancements at an event today, markets will receive the latest consumer confidence data, and earnings from NVIDIA, Home Depot, Salesforce, and Snowflake are on deck.
Exxon Mobil Fundamental Analysis
Exxon Mobil is an oil and gas company, the seventh-largest US company by revenue, the thirteenth largest globally, and the largest investor-owned oil company in the world.
So, why am I bearish on XOM despite its earnings beat?
Exxon Mobil reported revenues of $82.31 billion and earnings per share of $1.71, beating estimates of $80.63 and $1.70, respectively. Still, I turned bearish due to declining refining and chemical margins, structural oversupply risks, and execution risks tied to its Guyana and the Permian Basin projects. Downward earnings revisions, a high 5-year PEG ratio, and the current share price above average analyst price targets are additional red flags, adding to demand concerns from below-average global economic performance.
Metric | Value | Verdict |
P/E Ratio | 22.54 | Bearish |
P/B Ratio | 1.81 | Bullish |
PEG Ratio | 2.59 | Bearish |
Current Ratio | 1.15 | Bearish |
ROIC-WACC Ratio | Positive | Bullish |
Exxon Mobil Fundamental Analysis Snapshot
The price-to-earnings (P/E) ratio of 22.54 makes XOM an expensive stock in its sector. By comparison, the P/E ratio for the S&P 500 Index is 29.39.
The average analyst price target for XOM is $140.92, suggesting no upside potential with rising downside risks.
Exxon Mobil Technical Analysis
Today’s XOM Signal
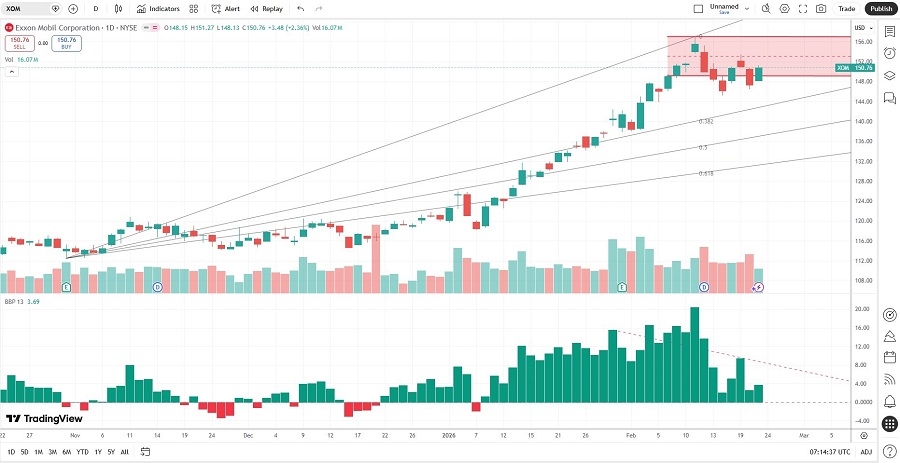
The XOM D1 chart shows price action inside a horizontal resistance zone.
It also shows price action between its ascending 0.0% and 38.2% Fibonacci Retracement Fan levels.
The Bull Bear Power Indicator is bullish with a negative divergence, approaching a bearish crossover.
The average bearish trading volumes are higher than the average bullish trading volumes.
XOM outperformed the S&P 500 Index, a bullish signal, but bearish catalysts are rising.
My XOM Short Stock Trade
XOM Entry Level: Between $148.13 and $151.27
XOM Take Profit: Between $120.81 and $125.93
XOM Stop Loss: Between $160.07 and $164.87
Risk/Reward Ratio: 2.29
Ready to trade our analysis of Exxon Mobil? Here is our list of the best stock brokers worth check.