
Short Trade Idea
Enter your short position between $108.26 (yesterday’s intra-day low) and $110.50 (the lower band of its horizontal resistance zone).
Market Index Analysis
- Ameren (AEE) is a member of the S&P 500 Index.
- This index trades inside a bearish chart pattern with decreasing bullish volumes.
- The Bull Bear Power Indicator of the S&P 500 Index is bearish with a descending trendline.
Market Sentiment Analysis
Equity futures are drifting higher despite a deep divide within the US Federal Reserve over the direction of monetary policy. Despite the minutes noting the potential for interest rate hikes, markets, for now, anticipate two more interest rate cuts. The New York Federal Reserve published a paper suggesting that US consumers shoulder 90% of tariff costs, as President Trump continues to pin his success on tariffs amid an affordability crisis. Earnings from Walmart will dominate the non-tariff headlines today, after DoorDash missed expectations, and Carvana plunged in after-hours trading.
Ameren Fundamental Analysis
Ameren is a utility company with 2.4 million electricity customers and 900,000 natural gas customers. It also owns the Bagnell Dam.
So, why am I bearish on AEE despite its earnings beat?
Ameren beat on the top and bottom line, but I remain bearish amid its $31.8 billion capital expenditure plan, as its 2025 interest payments surged 17% to $776 million, which can compress margins. AEE is also issuing new shares to finance its expansion, diluting existing shareholders. After issuing 3.7 million shares in 2025, I expect more to be issued this year. Regulatory issues with the Illinois Commerce Commission (ICC) add to an ongoing drag, while higher operating and maintenance costs are eroding profits.
Metric | Value | Verdict |
P/E Ratio | 20.83 | Bearish |
P/B Ratio | 2.40 | Bullish |
PEG Ratio | 2.64 | Bearish |
Current Ratio | 0.66 | Bearish |
ROIC-WACC Ratio | Negative | Bearish |
The price-to-earning (P/E) ratio of 20.83 makes AEE an expensive utility stock. By comparison, the P/E ratio for the S&P 500 Index is 29.56.
The average analyst price target for AEE is $114.00. This suggests negligible upside potential with increasing downside risks.
Ameren Technical Analysis
Today’s AEE Signal
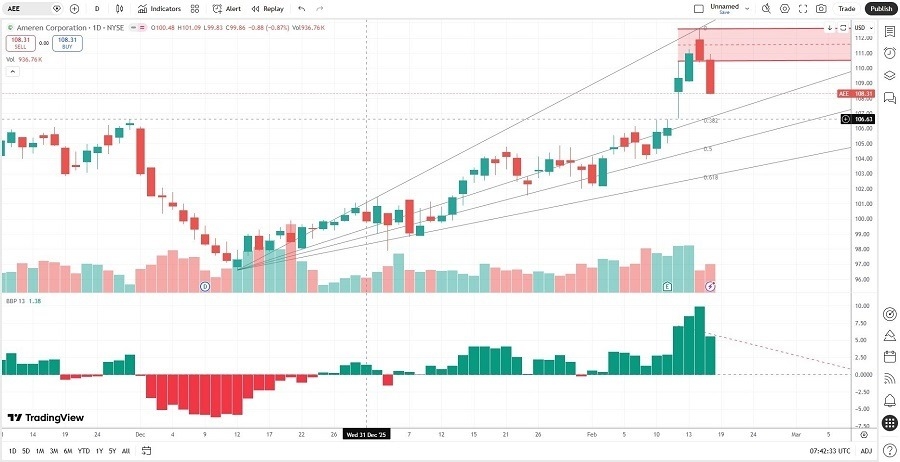
- The AEE D1 chart shows price action breaking down below its horizontal resistance zone.
- It also shows price action between its ascending 0.0% and 38.2% Fibonacci Retracement Fan levels.
- The Bull Bear Power Indicator is bullish with a descending trendline.
- The average bearish trading volumes have risen alongside the average bullish trading volumes.
- AEE corrected less than the S&P 500 Index, a bullish signal, but downside risks are accelerating.
My AEE Short Stock Trade
- AEE Entry Level: Between $108.26 and $110.50
- AEE Take Profit: Between $96.57 and $98.92
- AEE Stop Loss: Between $114.00 and $116.28
- Risk/Reward Ratio: 2.04
Ready to trade our analysis of Ameren? Here is our list of the best stock brokers worth checking out.