
Amazon.com (AMZN) stock signal, a fundamental snapshot, and a technical view on where its share price is heading. What to know before the market opens on February 3rd, 2026, after AMZN closed at $242.96, up 1.53% during the previous session, before advancing 0.24% in after-market hours.
Long Trade Idea
Enter your long position between $238.97 (an intermediate horizontal support level) and $245.63 (yesterday’s intra-day high).
Market Index Analysis
- Amazon.com (AMZN) is a member of the NASDAQ 100, the Dow Jones Industrial Average, the S&P 100, and the S&P 500 indices.
- All four indices trade within bearish chart patterns with decreasing bullish trading volumes.
- The Bull Bear Power Indicator of the NASDAQ 100 Index is bearish with a descending trendline.
Market Sentiment Analysis
Equity futures suggest a positive open, building on yesterday’s rally as markets brush off the sell-off in gold, silver, and Bitcoin. The US announced a trade deal with India after India and the EU signed a massive trade deal. Given the partial government shutdown, Friday’s January NFP report will be delayed. The sole focus remains tech earnings from the AI sector, which have been mixed. Palantir beat expectations and raised its outlook, sending shares higher in after-market action, with AMD set to report today.
Amazon.com Fundamental Analysis
Amazon.com is one of the Big Five US technology companies and a leader in the global AI race and cloud computing sector. It has excellent profit margins, but its debt remains excessive. AMZN is an industry disruptor but faces stiff competition from China.
So, why am I bullish on AMZN ahead of its earnings release?
I am bullish about its AWS unit, which has a rising backlog and infrastructure growth, resulting in faster capacity expansion. The $38 billion OpenAI deal and the $11 billion Project Rainier AI data center confirm AWS as a core AI player. I am equally bullish about its high-margin advertising business and operational efficiencies driven by technology. Therefore, I expect AMZN to report an outlook that will drive share prices higher.
Metric | Value | Verdict |
P/E Ratio | 34.32 | Bullish |
P/B Ratio | 6.92 | Bearish |
PEG Ratio | 1.81 | Bullish |
Current Ratio | 1.01 | Bearish |
ROIC-WACC Ratio | Positive | Bullish |
Amazon.com Fundamental Analysis Snapshot
The price-to-earnings (P/E) ratio of 34.12 makes AMZN a reasonably priced stock. By comparison, the P/E ratio for the NASDAQ 100 is 33.51.
The average analyst price target for AMZN is $296.47. This suggests good upside potential with reasonable downside risks.
Amazon.com Technical Analysis
Today’s AMZN Signal
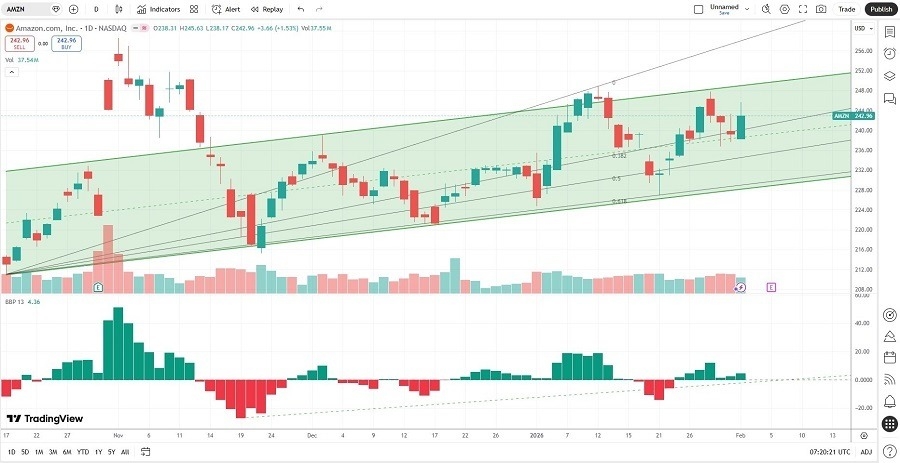
- The AMZN D1 chart shows price action inside a bullish price channel.
- It also shows price action between its ascending 0.0% and 38.2% Fibonacci Retracement Fan levels.
- The Bull Bear Power Indicator is bullish with an ascending trendline.
- The average bullish trading volumes are higher than the average bearish trading volumes.
- AMZN advanced more than the NASDAQ 100 Index, which is a bullish confirmation.
My AMZN Long Stock Trade
- AMZN Entry Level: Between $238.97 and $245.63
- AMZN Take Profit: Between $289.60 and $296.47
- AMZN Stop Loss: Between $220.99 and $224.70
- Risk/Reward Ratio: 2.82
Ready to trade our analysis of Amazon? Here is our list of the best stock brokers worth checking out.