

Long Trade Idea
Enter your long position between $190.72 (the lower band of its horizontal support zone) and 199.38 (yesterday’s intra-day high).
Market Index Analysis
Advanced Micro Devices (AMD) is a member of the NASDAQ 100 Index, the S&P 100 Index, and the S&P 500 Index.
All three indices are breaking down with mounting bearish catalysts.
The Bull Bear Power Indicator of the NASDAQ 100 Index is bearish with a descending trendline.
Market Sentiment Analysis
Equity futures are rising, attempting to recover from yesterday’s sell-off, amid renewed threats that AI will disrupt existing business models across corporate boardrooms. New tariff uncertainty following the Supreme Court’s ruling against President Trump’s tariffs, and the newly enacted global 15 tariff, sowed anger and confusion. IBM sales plunged amid a new Anthropic AI coding tool. Anthropic will reveal its latest advancements at an event today, markets will receive the latest consumer confidence data, and earnings from NVIDIA, Home Depot, Salesforce, and Snowflake are on deck.
Advanced Micro Devices Fundamental Analysis
Advanced Micro Devices is an industry-leading chip manufacturer at the forefront of the global AI race. It is also a core player in the gaming sector, where its hardware is among the best for high-end users, and a significant provider of server hardware to data centers.
So, why am I bullish on AMD despite its 28%+ correction?
I turned bullish on AMD amid its MI450 GPU and Helios rack-scale systems, which compete well with NVIDIA, but are 30% cheaper and have greater memory bandwidth. Partnerships with notable hyperscalers, including OpenAI and Oracle, are boosting its AI-driven data center growth, with revenue projected to reach nearly $23 billion this year. I am also bullish on the turnaround in PC and gaming markets, with demand for its Ryzen AI 400 processors offering revenue diversification.
Metric | Value | Verdict |
P/E Ratio | 75.33 | Bearish |
P/B Ratio | 4.62 | Bearish |
PEG Ratio | 0.52 | Bullish |
Current Ratio | 2.85 | Bullish |
ROIC-WACC Ratio | Negative | Bearish |
Advanced Micro Devices Fundamental Analysis Snapshot
The price-to-earning (P/E) ratio of 75.33 makes AMD an expensive stock. By comparison, the P/E ratio for the NASDAQ 100 is 33.96.
The average analyst price target for AMD is $286.30. This suggests excellent upside potential with decreasing downside risks.
Advanced Micro Devices Technical Analysis
Today’s AMD Signal
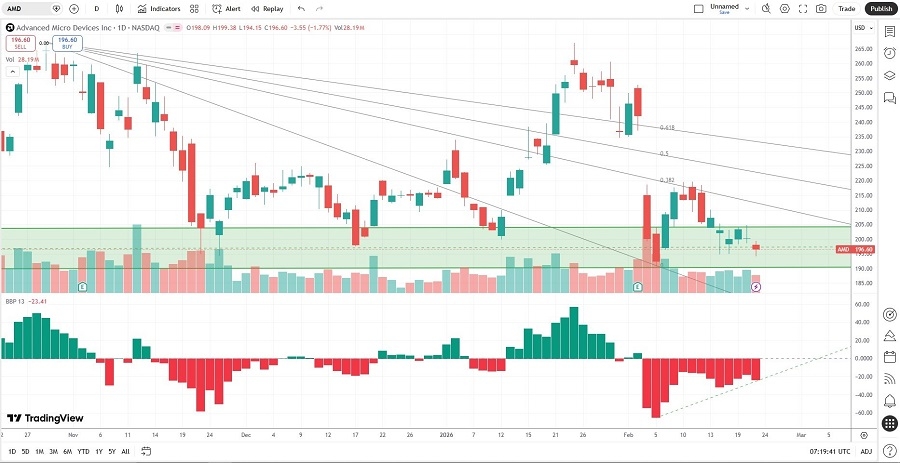
Advanced Micro Devices Price Chart
The AMD D1 chart shows price action inside a horizontal support zone.
It also shows price action between its descending 0.0% and 38.2% Fibonacci Retracement Fan levels.
The Bull Bear Power Indicator is bearish with an ascending trendline, nearing a bullish crossover.
The average bullish trading volumes are higher than the average bearish trading volumes over the past two weeks.
AMD corrected with the NASDAQ 100 Index, a bearish confirmation, but breakout catalysts are accumulating.
My AMD Long Stock Trade
AMD Entry Level: Between $190.72 and $199.38
AMD Take Profit: Between $267.08 and $275.09
AMD Stop Loss: Between $163.14 and $170.68
Risk/Reward Ratio: 2.77
Ready to trade our analysis of AMD Here is our list of the best stock brokers worth checking out.