
Long Trade Idea
Enter your long position between $29.16 (yesterday’s intra-day low) and $29.50 (yesterday’s intra-day high).
Market Index Analysis
- Comcast (CMCSA) is a member of the NASDAQ 100, S&P 100, and the S&P 500 indices.
- All three indices trade in bearish chart patterns with decreasing bullish volumes.
- The Bull Bear Power Indicator of the S&P 500 is bullish but shows a descending trendline.
Market Sentiment Analysis
Equity futures are mixed this morning as investors gear up for the earnings releases of 90 of the S&P 500 companies this week. The two-day FOMC meeting will start today, but markets expect no change in the benchmark interest rate will be announced tomorrow. A partial government shutdown is looming as Democrats will not back the current funding bill while it includes funding for the DHS amid the latest violence in Minnesota. Markets are also digesting more news on the tariff front after President Trump noted an increase in South Korean tariffs from 15% to 25%.
Comcast Fundamental Analysis
Comcast is a media and entertainment conglomerate. It is also the world’s fourth largest media company measured by revenue. In the US, it is the third-largest pay TV company, the second-largest cable TV company, and the largest internet service provider.
So, why am I bullish on CMCSA ahead of its earnings release?
Valuations remain low, and I am bullish about its push into sports and developments surrounding its Peacock streaming business, which has over 40 million subscribers and a clear path to profitability. The Xfinity Membership program could attract lost customers, driven by its Xfinity Mobile service, which is an underappreciated asset. I am equally bullish about its Universal Destinations & Experiences unit and see CMCSA reporting solid guidance for the current quarter.
Metric | Value | Verdict |
P/E Ratio | 4.89 | Bullish |
P/B Ratio | 1.10 | Bullish |
PEG Ratio | 4.38 | Bearish |
Current Ratio | 0.88 | Bearish |
ROIC-WACC Ratio | Positive | Bullish |
The price-to-earning (P/E) ratio of 4.89 makes CMCSA an inexpensive stock. By comparison, the P/E ratio for the S&P 500 is 31.39.
The average analyst price target for CMCSA is $33.76. This suggests moderate upside potential, but I see prices rising towards the high end of the estimate at $44.00, while downside risks are acceptable.
Comcast Technical Analysis
Today’s CMCSA Signal
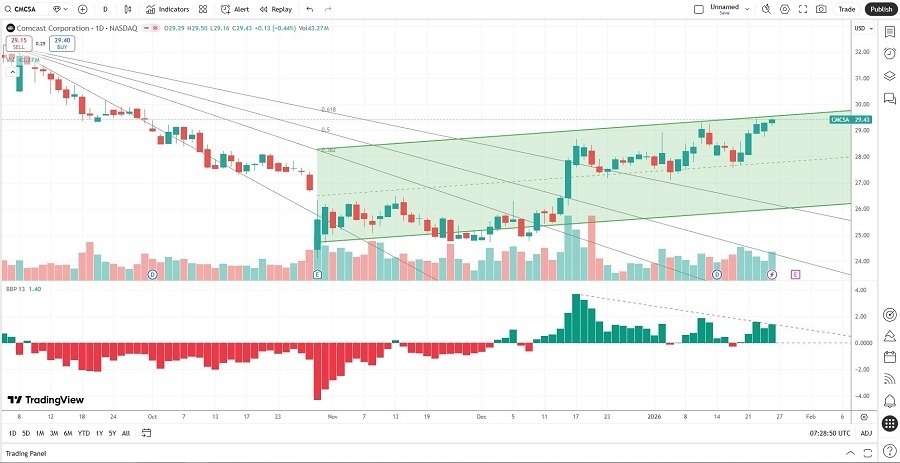
- The CMCSA D1 chart shows price action inside a bullish price channel.
- It also shows price action breaking out above its ascending Fibonacci Retracement Fan.
- The Bull Bear Power Indicator is bullish with a negative divergence, hinting at potential volatility ahead.
- The average trading volumes have been higher during bullish days than during bearish days.
- CMCSA advanced as the S&P 500 Index struggled, a significant bullish trading signal.
My CMCSA Long Stock Trade
- CMCSA Entry Level: Between $29.16 and $29.50
- CMCSA Take Profit: Between $37.23 and $37.82
- CMCSA Stop Loss: Between $25.43 and $26.09
- Risk/Reward Ratio: 2.16
Ready to trade our analysis of Comcast? Here is our list of the best stock brokers worth checking out.