
Last night I was reading a thread on a well-known Forex forum that was written by a guy who had developed his own Forex trend trading strategy. I got the feeling that he was a young and relatively inexperienced trader, but as rigid systems go, he had come up with a pretty good system and a good attitude. I wish him every success.
His strategy was normal enough: follow the strong trends, buy the dips in uptrends, sell the rallies in downtrends. So far, so good. The extra ingredient he put forward that interested me as I have not seen it discussed for a while, was to measure swing highs and lows by candle closes, not absolute high or low prices, and to use watch swings on a lower timeframe to determine whether the trend was still valid from moment to moment.
For example, suppose a weekly chart shows a clear upwards trend. You could drop down to, say, the daily chart, and mark the nearest key low, i.e. where the price last pulled back and began to turn up again. Now as soon as the price falls and closes below that key low close on the same time frame, the trend has been invalidated, and you don’t trade it again until a key high close is broken with a close above it.
My take on this is that it is an attractive idea to try to find some kind of filter to improve the results of a trend following strategy. This is because a simple trend trading strategy can be very painful if a strong trend suddenly reverses, and just keeps going against the trend for a long time as it has a long way to go before it reaches the other side of prices either 3 months or 6 months ago. In this situation, you might get lots of trade entries, one after the other, over a few weeks, all of them losers. In trading, a large number of consecutive losing trades is just about the worst thing that can possibly happen to your account! Even if the system as a whole has a positive expectancy, the more you can soften losing streaks, the better.
So, what answer did I come up with? Well, I found that using average volatility was generally a good filter. Entry candles had to exceed their average true range over the last five-day period. This can help, because usually candles are better indicators of the end of a pull back if they are relatively large. I found it certainly improved results.
However, I still am toying with the idea of testing whether defining the health of a trend on a lower time frame could be an even better filter, or maybe a complimentary filter to volatility.
Where my approach might differ from using swing highs or lows, would probably be to use an even shorter time frame chart such as the hourly or 4 hourly and try to draw key horizontal support and resistance levels. The idea here is that in an uptrend, if a key support level is broken, you would cease trading the trend until the price was at least established back above it.
For example, I like the idea of looking for a short trade on USD/JPY right now, but I would like to see a break below the key support level at 103.12 first:
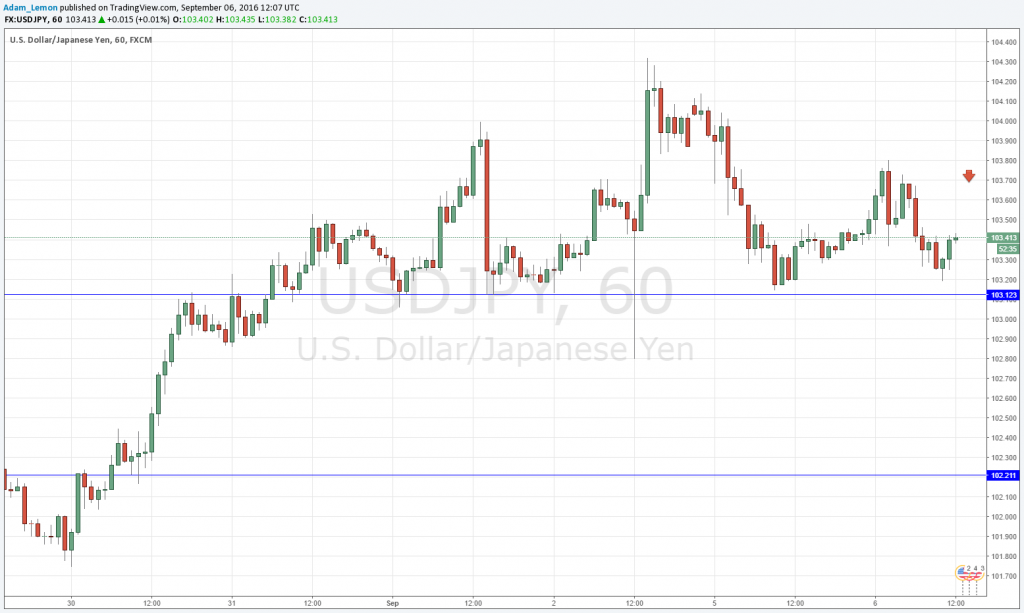 USDJPY
I have to admit that I have not done any testing of these various filters mentioned, so I am not sure which might work best. Testing could be problematic, as there is an element of subjectivity and I might remember historical prices subconsciously (this is always a danger with discretionary back testing). I do know though that in Forex, very deep pull backs against the trend often tend to set up the best trades, so I am not convinced that any such filter would work better than a volatility filter, or even improve results at all. I also know that adding a filter of 1 month to the trend definition look-back periods which I explained previously worsens the results for most currency pairs, although with commodities it often improves results. Forex “likes” to pull back.
Still, it would be interesting to test it out if I can find a way to do it mathematically and truly objectively. If I do, I’ll let you know how it goes!