Silver gapped higher on Wednesday, as interest rates relaxed a bit, as word got out that the Americans and Iranians were talking.
Technical Analysis
The following are the most recent pieces of Forex technical analysis from around the world. The Forex technical analysis below covers the various currencies on the market and the most recent trends, technical indicators, as well as resistance and support levels.


Silver gapped higher on Wednesday, as interest rates relaxed a bit, as word got out that the Americans and Iranians were talking.
The gold market rallied on Wednesday, as traders reacted to falling rates in the US. At this point, any hope of rates dropping could bring buyers into the market.
The US dollar rallied somewhat on Wednesday against the Japanese yen, with the 160 level above offering some kind of massive ceiling.
Nvidia remains rangebound but has seen a lot of upward pressure on Wednesday, as the “risk on” behavior of traders has reentered the market.
The market is likely to see a lot of noise in general, but at this point in time, it is likely that we will continue to have to watch the rate yields in the US for clues.
The markets are being driven by combatants, and whatever next tweet or statement one of the three make as we just don't know how to price risk. Unfortunately, this is likely to continue.
The US Dollar rallied against the Swiss Franc on Wednesday, as we continue to see the interest rate differential above all else drive the markets.
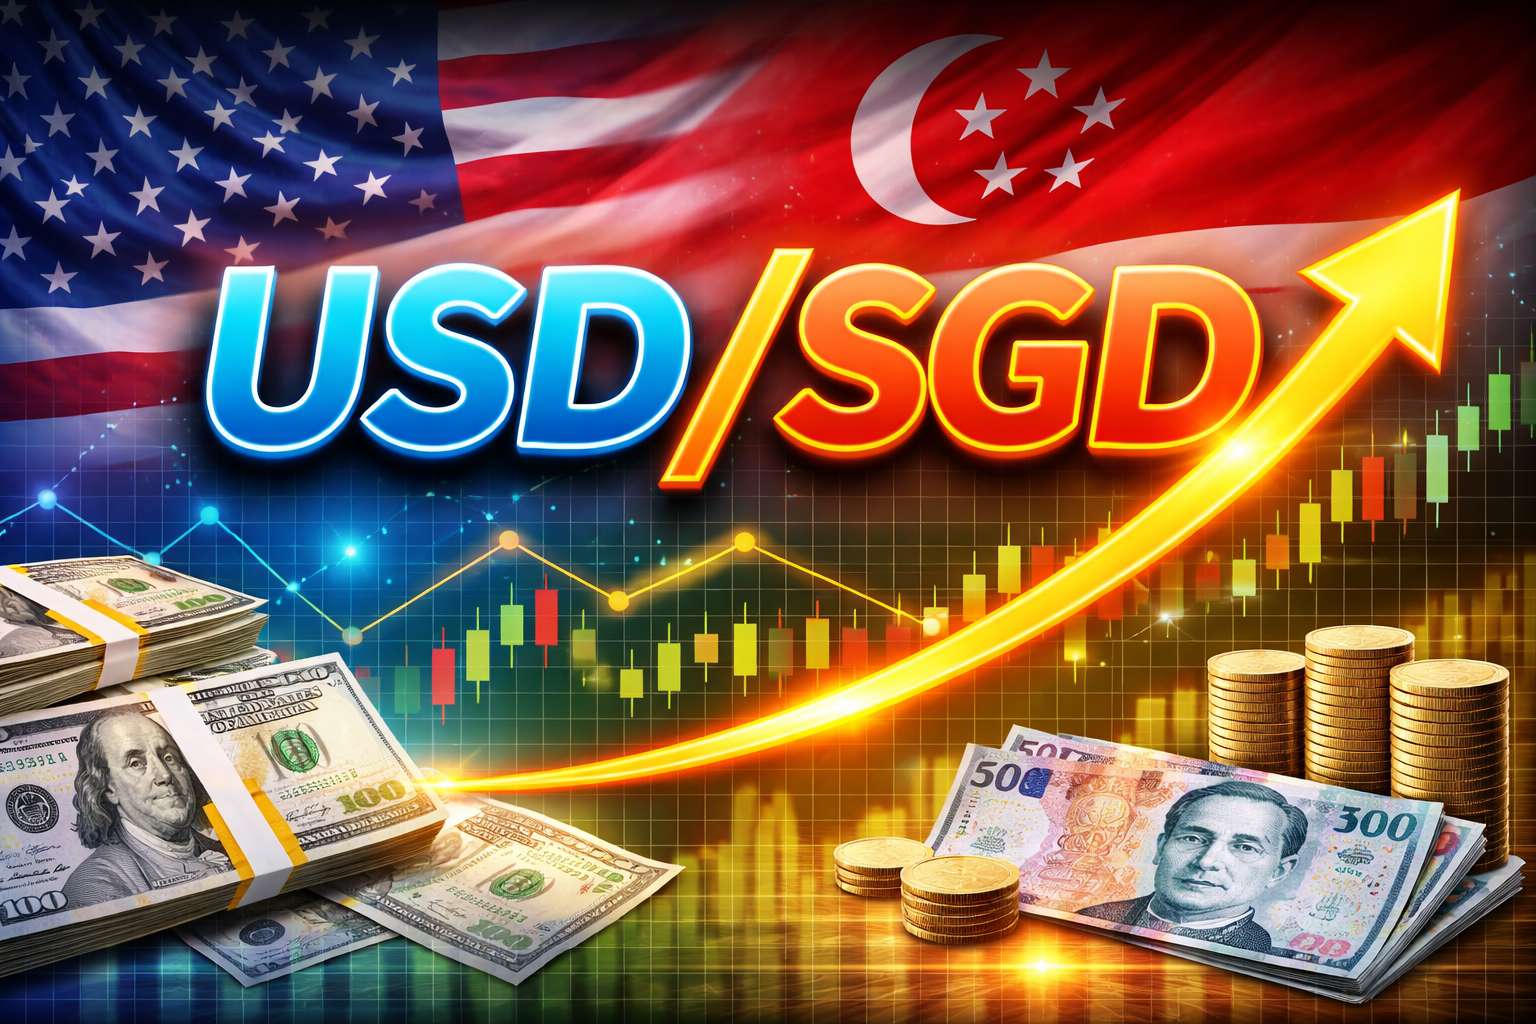
The USD/SGD is near the 1.27970 vicinity with fast fluctuations still being seen within the currency pair, this as financial institutions react to broad market conditions spurred on by concerns about the Iranian war.
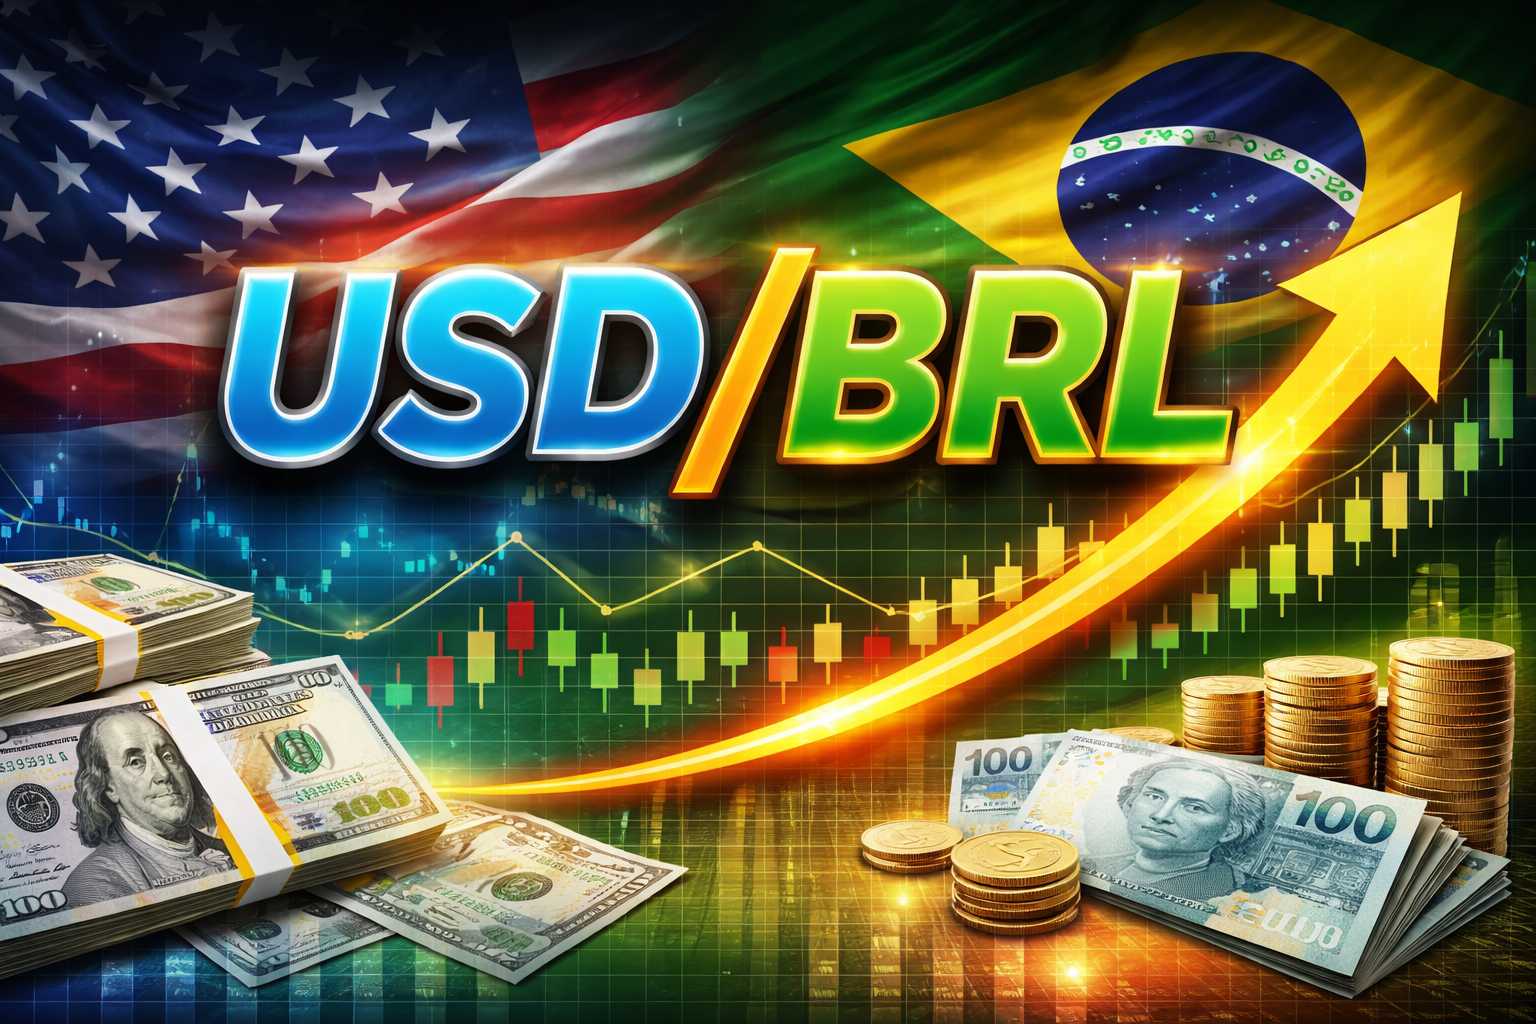
The USD/BRL closed yesterday’s trading around the 5.2330 mark, this can be viewed as a solid result for the Brazilian Real taking into consideration the high degree of nervous gyrations in the broad Forex market.
Higher lows have continued to hold over two weeks, strengthening the bullish case.
The USD/CAD pair continues to be one that I am watching, and it looks like the dollar is finally breaking out against the Loonie on Tuesday. Can it hold?
Short-term rallies could happen in silver, but I think we still have a long way to go before we get overly bullish again.
Investors are looking to bonds more than gold as of late, with higher interest rates in America causing issues for gold bulls. Ultimately, everything is running on the idea of “stagflation.”
I am watching the Swiss franc closely, as we are in the process of trying to find the bottom. With this, the pair continues to move on the 10-year yield in America, and the possibility of SNB intervention.
The Euro continues to see a lot of overhead pressures, as rates in the United States continue to rise. At this point, the market continues to watch the war for headlines as well.