.webp)
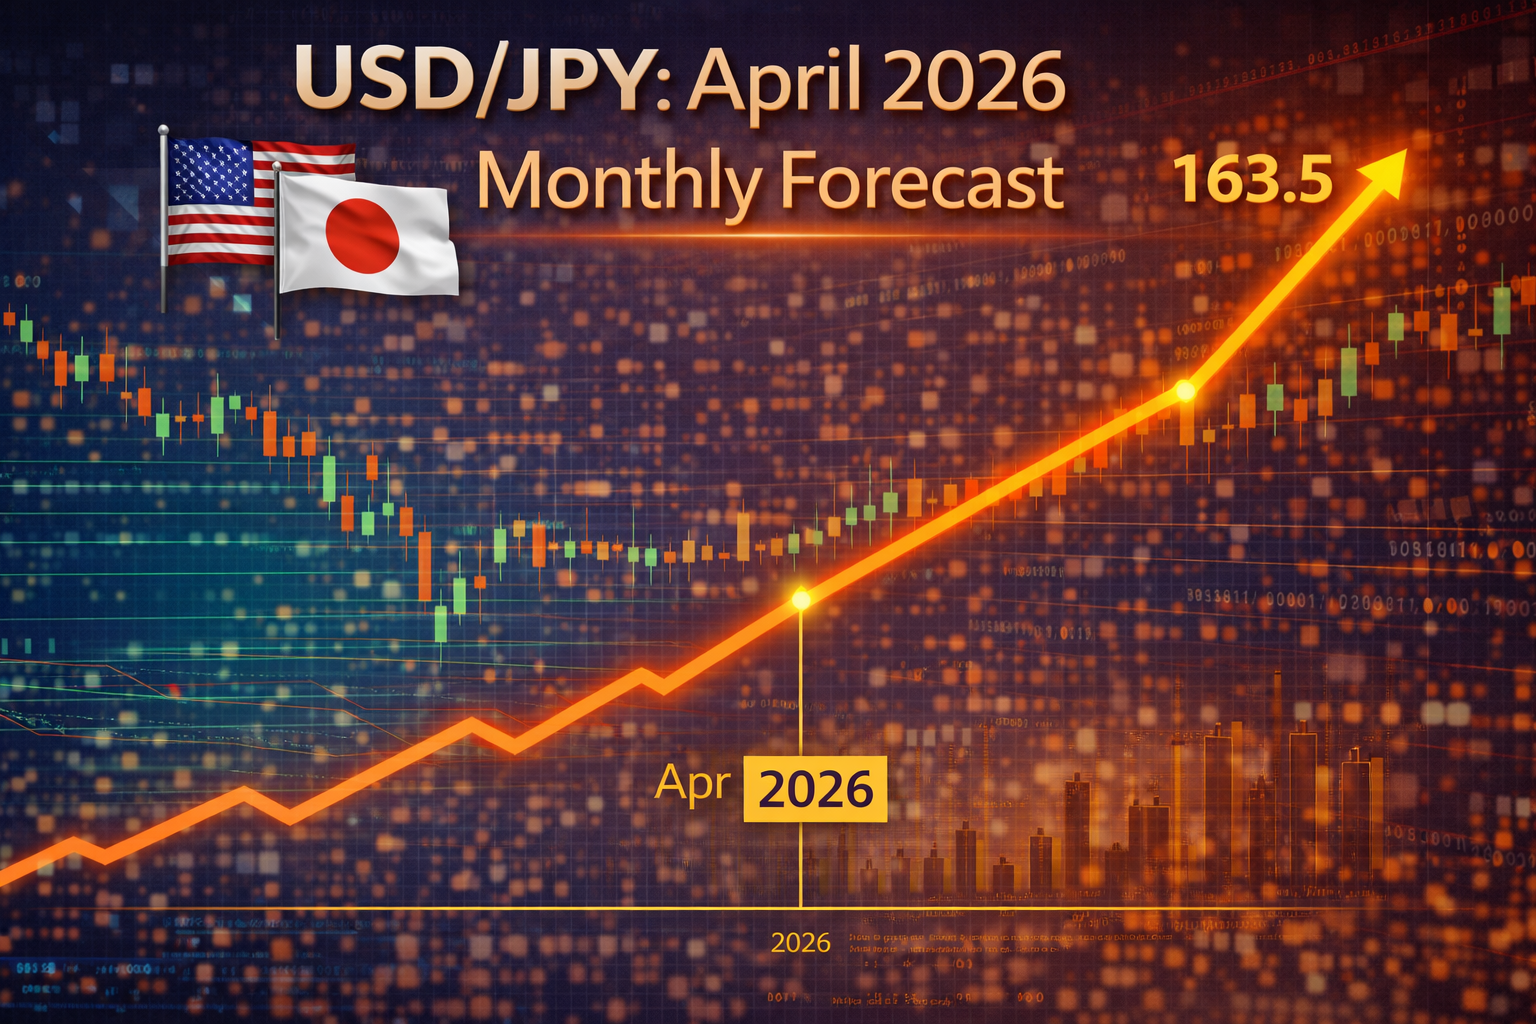
The USD/JPY pulled back on Tuesday after failing near ¥160. This area continues to be paramount in this pair.
Technical Analysis
The following are the most recent pieces of Forex technical analysis from around the world. The Forex technical analysis below covers the various currencies on the market and the most recent trends, technical indicators, as well as resistance and support levels.


The USD/JPY pulled back on Tuesday after failing near ¥160. This area continues to be paramount in this pair.
Silver has rallied hard on Tuesday, as we are reacting to falling yields in the United States. With war headlines coming out randomly, be careful with your position size.
The US dollar rallied on Tuesday but gave back a lot of gains once we broke above the crucial 0.80 level. This is also where the crucial 200 Day EMA sits.
Bitcoin continues to see a bit of stability, despite the world being on fire. This isn’t what you would expect, so its important to pay attention to it.
The US dollar continues to be the main focus of traders, as rates in the US continue to push things around.
The German DAX has rallied a bit in the early session on Tuesday, as traders are reacting to potential good news coming out of Iran. Furthermore, it is end of quarter trading.
Crypto has long been known for its volatility, and Bitcoin’s (BTC) price action in late March 2026 has lived up to that understanding. Its movement has been defined by sharp reactions to geopolitical headlines, particularly those involving U.S.-Iran tensions.
The Euro continues to see a lot of noise, but the potential for the Iranians to look for peace is going to be a major driver of risk appetite.
The bond markets continue to drive where we go in stock markets, with the 4.30% level being a major floor for those rates.
The USD/ZAR exchange rate pulled back on Wednesday as the US dollar retreated. It dropped to 16.95, down slightly from this week's high of 17.23. This retreat may continue in the near term after the pair formed a rising wedge pattern.
The USD/MXN exchange rate has pulled back in the past few days, moving from a high of 18.20 on Monday to 17.93. This retreat may continue after the pair formed a rising wedge pattern on the daily chart.
The EUR/USD pair rose by over 80 basis points as the US dollar index retreated amid hopes that the ongoing Iran war was about to end. It jumped to 1.1560, a few points above last month’s low of 1.1412.
Bitcoin price rose modestly, mirroring the performance of the American stock market, which soared by over 2%. The BTC/USD pair rose to 68,000 from this week's low of 66,000. It remains in a bear market after falling by 46% from its highest point in October last year.
The AUD/USD exchange rate rose by 0.60% on Wednesday morning as market participants embraced a risk-on sentiment amid hopes that the US-Iran war was about to end. It rose to 0.6688, up substantially from this week's low of 0.6830.
The USD/JPY is trading near values seen in January as it traverses as of this writing near the 159.520 vicinity, but this time around financial institutions do not seem as afraid about potential BoJ interventions.