The US dollar continues to see momentum to the upside against the yen on Friday.
Technical Analysis
The following are the most recent pieces of Forex technical analysis from around the world. The Forex technical analysis below covers the various currencies on the market and the most recent trends, technical indicators, as well as resistance and support levels.


The US dollar continues to see momentum to the upside against the yen on Friday.
The weekend will be about the Islamabad meetings between the Iranian and American officials. If we get good news, it should help gold overall as rates should fall.
The silver market has been a bit positive on Friday, as traders are waiting to see how the weekend plays out with the peace talks between the Iranians and Americans.
The interest rates in the United States will continue to be a massive driver of where we are going next.
If we get an agreement gets done this weekend in Islamabad, the markets will celebrate.

The Mexican peso will be highly influenced by the peace talks over the weekend in Pakistan, as it will be moving interest rate markets.
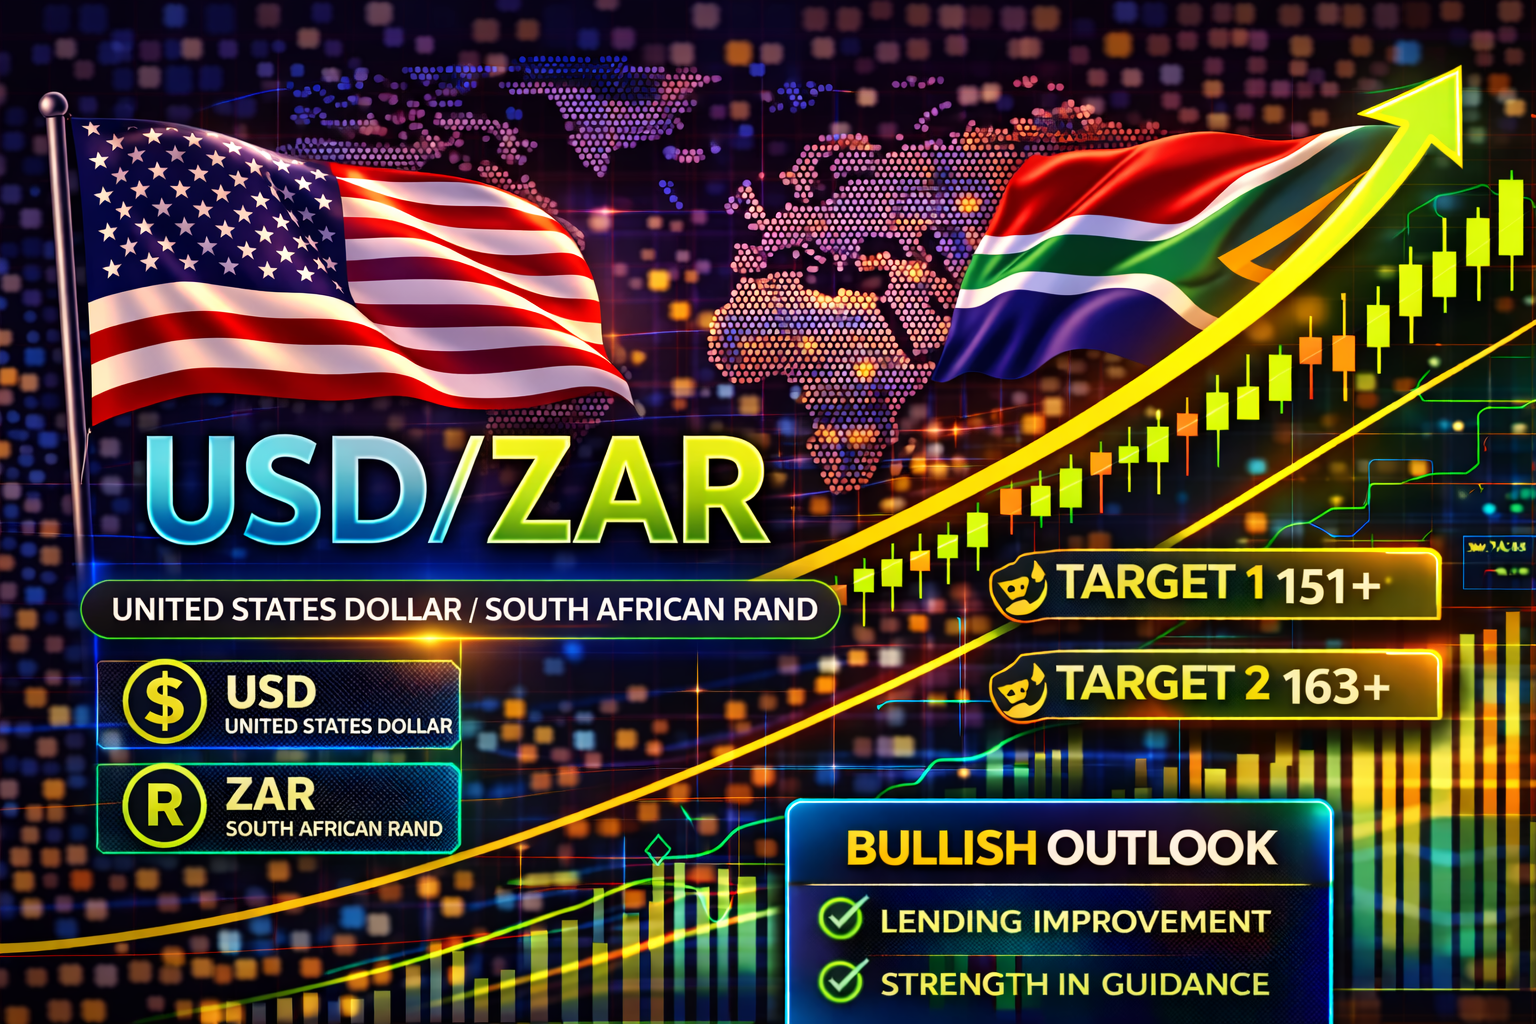
The USD/ZAR went slightly higher this morning upon its opening, following much of the broad Forex market as USD centric strength showed some momentum, the currency pair is around 16.51650 depending on bids and asks.
Like most risk-paired assets, this gapped firmly lower but has been rising quite strongly ever since the Tokyo open. The resistant area at $1.3450 seems likely to hold.
The EUR/USD exchange rate retreated slightly after the US published the latest consumer inflation report, which largely met expectations. It it was trading at 1.1685 on Monday morning, a few points below last week’s high of 1.1740.
Bitcoin price remained in an uptrend on Monday as American investors continued accumulating the coin. The BTC/USD pair rose to 74,000 on Monday, its highest point in over three weeks. It has moved into a bull market after rising by over 20% from its lowest level this year.
The AUD/USD exchange rate jumped to the highest point since March 20 as the US dollar softened after last Friday’s consumer inflation report.
The EUR/USD finished near 1.17246 going into this week, this after seeing marks on Tuesday of this past week around the 1.15300 level.
The two-week ceasefire agreed between the USA and Iran early last week has boosted stock markets and suppressed energy prices, creating a more risk-on environment, but sentiment may darken as the first round of talks in Pakistan ends without a deal.
WTI Crude Oil went into the this weekend above the 90.000 USD mark, and by now speculators should be ready in their thinking for the opening of trading tomorrow which is certain to be an adventure as the week starts.
Coincidence or not, the price of Coffee Arabica moved in a correlated manner to the values of the WTI Crude Oil market this past week, this as volatility moved based on caution being expressed by traders via the Iranian ceasefire.